


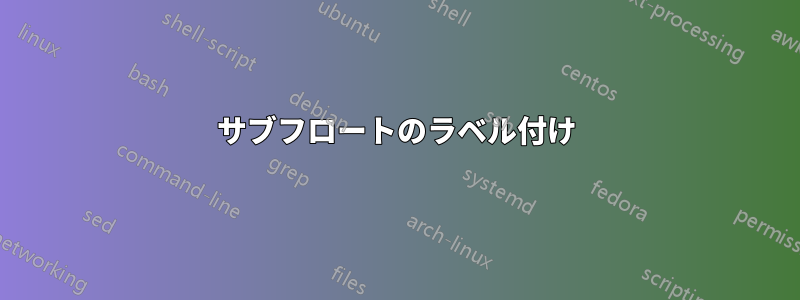
私は 5 行 6 列の 30 個の図を含む図を作成中です。やりたいことは、図の各行の始めにテキストを書きたいのですが、横書きではなく縦書きにしたいということです。列にはテキストを書いて、2 つの列ごとにグループ化したいので、たとえば列 1 と 2 の上部に data1 を書き込み、2 つの列の中央に配置します。これは私にとっては本当に難しいことです。
この図は、赤いマーカーにテキストを入れたい場所に何をしたいのかを説明しています

これは私のコードのサンプルです:
\begin{figure*}[t]
\centering
\subfloat[]{\includegraphics[width=.33\linewidth]{../Hussein/MatFiles/Lights/k640_Sensor_Lights_On_1000mm-pgms/k640_Sensor_Lights_On_1000mm-pgms_no_of_levels}}
\subfloat[]{\includegraphics[width=.33\linewidth]{../Hussein/MatFiles/Lights/k640_Sensor_Lights_On_1000mm-pgms/k640_Sensor_Lights_On_1000mm-pgms_entropy}}
\subfloat[]{\includegraphics[width=.33\linewidth]{../Hussein/MatFiles/Lights/k640_Sensor_Lights_On_1000mm-pgms/k640_Sensor_Lights_On_1000mm-pgms_mean}}
\subfloat[]{\includegraphics[width=.33\linewidth]{../Hussein/MatFiles/Lights/x640_Sensor_Lights_On_1000mm-pgms/x640_Sensor_Lights_On_1000mm-pgms_no_of_levels}}
\subfloat[]{\includegraphics[width=.33\linewidth]{../Hussein/MatFiles/Lights/x640_Sensor_Lights_On_1000mm-pgms/x640_Sensor_Lights_On_1000mm-pgms_entropy}}
\subfloat[]{\includegraphics[width=.33\linewidth]{../Hussein/MatFiles/Lights/x640_Sensor_Lights_On_1000mm-pgms/x640_Sensor_Lights_On_1000mm-pgms_mean}}\\
\subfloat[]{\includegraphics[width=.33\linewidth]{../Hussein/MatFiles/Lights/x320_Sensor_Lights_On_1000mm-pgms/x320_Sensor_Lights_On_1000mm-pgms_no_of_levels}}
\subfloat[]{\includegraphics[width=.33\linewidth]{../Hussein/MatFiles/Lights/x320_Sensor_Lights_On_1000mm-pgms/x320_Sensor_Lights_On_1000mm-pgms_entropy}}
\subfloat[]{\includegraphics[width=.33\linewidth]{../Hussein/MatFiles/Lights/x320_Sensor_Lights_On_1000mm-pgms/x320_Sensor_Lights_On_1000mm-pgms_mean}}
\subfloat[]{\includegraphics[width=.33\linewidth]{../Hussein/MatFiles/Lights/x320_Sensor_Lights_On_1000mm-pgms/x320_Sensor_Lights_On_1000mm-pgms_mean}}
\subfloat[]{\includegraphics[width=.33\linewidth]{../Hussein/MatFiles/Lights/x320_Sensor_Lights_On_1000mm-pgms/x320_Sensor_Lights_On_1000mm-pgms_mean}}
\subfloat[]{\includegraphics[width=.33\linewidth]{../Hussein/MatFiles/Lights/x320_Sensor_Lights_On_1000mm-pgms/x320_Sensor_Lights_On_1000mm-pgms_mean}}
\caption{aaa}
\label{fig:rulascore}
\end{figure*}
アップデート:
「下記」のコードを更新しましたが、この画像のように何も表示されません
使用されたコード:
\begin{figure*}
\centering
\subfloat[]{%
\begin{tikzpicture}[remember picture]
  \node[mynode] (image11)
  {\includegraphics[trim=2cm 7cm 2cm 7cm, clip=true,width=.15\linewidth]{../Hussein/MatFiles/Lights/k640_Sensor_Lights_On_1000mm-pgms/k640_Sensor_Lights_On_1000mm-pgms_no_of_levels}};
\end{tikzpicture}}\hfill
\subfloat[]{%
\begin{tikzpicture}[remember picture]
  \node[mynode] (image12)
  {\includegraphics[trim=2cm 7cm 2cm 7cm, clip=true,width=.15\linewidth]{../Hussein/MatFiles/Lights/k640_Sensor_Lights_On_1000mm-pgms/k640_Sensor_Lights_On_1000mm-pgms_entropy}};
\end{tikzpicture}}\hfill
\subfloat[]{%
\begin{tikzpicture}[remember picture]
  \node[mynode] (image13)
  {\includegraphics[trim=2cm 7cm 2cm 7cm, clip=true,width=.15\linewidth]{../Hussein/MatFiles/interference/1500/x320_Sensor_Lights_On_1500mm_with_interference_distance_1100-pgms/x320_Sensor_Lights_On_1500mm_with_interference_distance_1100-pgms_no_of_levels}};
\end{tikzpicture}}\hfill
\subfloat[]{%
\begin{tikzpicture}[remember picture]
  \node[mynode] (image14)
  {\includegraphics[trim=2cm 7cm 2cm 7cm, clip=true,width=.15\linewidth]{../Hussein/MatFiles/interference/1500/x320_Sensor_Lights_On_1500mm_with_interference_distance_1100-pgms/x320_Sensor_Lights_On_1500mm_with_interference_distance_1100-pgms_entropy}};
\end{tikzpicture}}\hfill
\subfloat[]{%
\begin{tikzpicture}[remember picture]
  \node[mynode] (image15)
  {\includegraphics[trim=2cm 7cm 2cm 7cm, clip=true,width=.15\linewidth]{../Hussein/MatFiles/interference/1500/x320_Sensor_Lights_On_1500mm_with_interference_distance_1100-pgms/x320_Sensor_Lights_On_1500mm_with_interference_distance_1100-pgms_no_of_levels}};
\end{tikzpicture}}\hfill
\subfloat[]{%
\begin{tikzpicture}[remember picture]
  \node[mynode] (image16)
  {\includegraphics[trim=2cm 7cm 2cm 7cm, clip=true,width=.15\linewidth]{../Hussein/MatFiles/interference/1500/x320_Sensor_Lights_On_1500mm_with_interference_distance_1100-pgms/x320_Sensor_Lights_On_1500mm_with_interference_distance_1100-pgms_entropy}};
\end{tikzpicture}}\\
\subfloat[]{%
\begin{tikzpicture}[remember picture]
  \node[mynode] (image21)
  {\includegraphics[trim=2cm 7cm 2cm 7cm, clip=true,width=.15\linewidth]{../Hussein/MatFiles/interference/1500/x320_Sensor_Lights_On_1500mm_with_interference_distance_1100-pgms/x320_Sensor_Lights_On_1500mm_with_interference_distance_1100-pgms_no_of_levels}};
\end{tikzpicture}}\hfill
\subfloat[]{\includegraphics[trim=2cm 7cm 2cm 7cm, clip=true,width=.15\linewidth]{../Hussein/MatFiles/interference/1500/x320_Sensor_Lights_On_1500mm_with_interference_distance_1100-pgms/x320_Sensor_Lights_On_1500mm_with_interference_distance_1100-pgms_entropy}}\hfill
\subfloat[]{\includegraphics[trim=2cm 7cm 2cm 7cm, clip=true,width=.15\linewidth]{../Hussein/MatFiles/interference/1500/x320_Sensor_Lights_On_1500mm_with_interference_distance_1100-pgms/x320_Sensor_Lights_On_1500mm_with_interference_distance_1100-pgms_no_of_levels}}\hfill
\subfloat[]{\includegraphics[trim=2cm 7cm 2cm 7cm, clip=true,width=.15\linewidth]{../Hussein/MatFiles/interference/1500/x320_Sensor_Lights_On_1500mm_with_interference_distance_1100-pgms/x320_Sensor_Lights_On_1500mm_with_interference_distance_1100-pgms_entropy}}
\caption{aaa}
\label{fig:rulascore}
\end{figure*}

\begin{tikzpicture}[remember picture,overlay]
\node[above] at ( $ (image11.north)!0.5!(image12.north) $ ) {some text goes here};
\node[above] at ( $ (image13.north)!0.5!(image14.north) $ ) {some text goes here};
\node[above] at ( $ (image15.north)!0.5!(image16.north) $ ) {some text goes here};
\node[rotate=90,yshift=10pt] at (image11.west) {some text};
\node[rotate=90,yshift=10pt] at (image21.west) {some text};
\end{tikzpicture}
答え1
一つの可能性としては、TikZアイデアは、最初の行と最初の列の各図を名前付きノード内に配置し、これらのノードを使用してテキストを配置することです。
\documentclass{article}
\usepackage{subfig}
\usepackage[demo]{graphicx}
\usepackage{tikz}
\usetikzlibrary{calc}

\tikzset{
  mynode/.style={anchor=south west,inner sep=0,outer sep=0pt}}

\begin{document}

\begin{figure*}
\centering
\subfloat[]{%
\begin{tikzpicture}[remember picture]
  \node[mynode] (image11)
  {\includegraphics[width=.15\textwidth]{../Hussein/MatFiles/Lights/k640_Sensor_Lights_On_1000mm-pgms/k640_Sensor_Lights_On_1000mm-pgms_no_of_levels}};
\end{tikzpicture}}\hfill
\subfloat[]{%
\begin{tikzpicture}[remember picture]
  \node[mynode] (image12)
  {\includegraphics[width=.15\textwidth]{../Hussein/MatFiles/Lights/k640_Sensor_Lights_On_1000mm-pgms/k640_Sensor_Lights_On_1000mm-pgms_entropy}};
\end{tikzpicture}}\hfill
\subfloat[]{%
\begin{tikzpicture}[remember picture]
  \node[mynode] (image13)
  {\includegraphics[width=.15\textwidth]{../Hussein/MatFiles/Lights/k640_Sensor_Lights_On_1000mm-pgms/k640_Sensor_Lights_On_1000mm-pgms_mean}};
\end{tikzpicture}}\hfill
\subfloat[]{%
\begin{tikzpicture}[remember picture]
  \node[mynode] (image14)
  {\includegraphics[width=.15\textwidth]{../Hussein/MatFiles/Lights/x640_Sensor_Lights_On_1000mm-pgms/x640_Sensor_Lights_On_1000mm-pgms_no_of_levels}};
\end{tikzpicture}}\hfill
\subfloat[]{%
\begin{tikzpicture}[remember picture]
  \node[mynode] (image15)
  {\includegraphics[width=.15\textwidth]{../Hussein/MatFiles/Lights/x640_Sensor_Lights_On_1000mm-pgms/x640_Sensor_Lights_On_1000mm-pgms_entropy}};
\end{tikzpicture}}\hfill
\subfloat[]{%
\begin{tikzpicture}[remember picture]
  \node[mynode] (image16)
  {\includegraphics[width=.15\textwidth]{../Hussein/MatFiles/Lights/x640_Sensor_Lights_On_1000mm-pgms/x640_Sensor_Lights_On_1000mm-pgms_mean}};
\end{tikzpicture}}\\
\subfloat[]{%
\begin{tikzpicture}[remember picture]
  \node[mynode] (image21)
  {\includegraphics[width=.15\textwidth]{../Hussein/MatFiles/Lights/x320_Sensor_Lights_On_1000mm-pgms/x320_Sensor_Lights_On_1000mm-pgms_no_of_levels}};
\end{tikzpicture}}\hfill
\subfloat[]{\includegraphics[width=.15\textwidth]{../Hussein/MatFiles/Lights/x320_Sensor_Lights_On_1000mm-pgms/x320_Sensor_Lights_On_1000mm-pgms_entropy}}\hfill
\subfloat[]{\includegraphics[width=.15\textwidth]{../Hussein/MatFiles/Lights/x320_Sensor_Lights_On_1000mm-pgms/x320_Sensor_Lights_On_1000mm-pgms_mean}}\hfill
\subfloat[]{\includegraphics[width=.15\textwidth]{../Hussein/MatFiles/Lights/x320_Sensor_Lights_On_1000mm-pgms/x320_Sensor_Lights_On_1000mm-pgms_mean}}\hfill
\subfloat[]{\includegraphics[width=.15\textwidth]{../Hussein/MatFiles/Lights/x320_Sensor_Lights_On_1000mm-pgms/x320_Sensor_Lights_On_1000mm-pgms_mean}}\hfill
\subfloat[]{\includegraphics[width=.15\textwidth]{../Hussein/MatFiles/Lights/x320_Sensor_Lights_On_1000mm-pgms/x320_Sensor_Lights_On_1000mm-pgms_mean}}
\caption{aaa}
\label{fig:rulascore}
\end{figure*}

\begin{tikzpicture}[remember picture,overlay]
\node[above] at ( $ (image11.north)!0.5!(image12.north) $ ) {some text goes here};
\node[above] at ( $ (image13.north)!0.5!(image14.north) $ ) {some text goes here};
\node[above] at ( $ (image15.north)!0.5!(image16.north) $ ) {some text goes here};
\node[rotate=90,yshift=10pt] at (image11.west) {some text};
\node[rotate=90,yshift=10pt] at (image21.west) {some text};
\end{tikzpicture}

\end{document}

オプションdemoは、graphicx実際の数字を黒い四角形に置き換えるだけです。ない実際のドキュメントではそのオプションを使用します。
質問とは直接関係ありませんが、画像がテキスト領域の幅に対して広すぎます (または、2 列のドキュメントを作成しているのでしょうか?)。いずれにしても、幅を から に変更し0.33\linewidth、0.15\textwidth各行の数字を均等に分離しました (もちろん、これらの変更を元に戻すことができます)。また、の\hfillオプションは制限が厳しすぎる可能性があるため、例ではこれを省略しました。[t]figure