


私はuseasboundingboxtikz 画像を光学的に中央に配置するために使用します。キャプションを境界ボックスの左端に揃えたいのですが、通常は の環境で行うことができますmeasuredfigure。threeparttable以下のコードではそれができません。何が間違っているのでしょうか? キャプションは境界ボックスの左端である y 軸に揃える必要があります。
(最小限の例ではなく申し訳ありません。いくつかのプロットのパラメータをグローバルに設定しましたが、どこに問題があるのかわかりません。)
\documentclass{article}

\usepackage{tikz}
\usepackage{threeparttable}
\usepackage{calc}
\usepackage[singlelinecheck=false]{caption}


\begin{document}
\newlength\plotheight % Height of plotting area
\setlength\plotheight{.4\textwidth}
\newlength\plotwidth % Width of plotting area
\setlength\plotwidth{.7\textwidth}
\newlength\axissep % Space between plotting area and axis
\setlength\axissep{\parindent}
\newlength\tickl % Length of minor ticks
\setlength\tickl{2mm}
\newlength\ylabsep % space between plotting area and ylab
\setlength\ylabsep{\axissep+\tickl+2em}
\newlength\xlabsep % space between plotting area and ylab
\setlength\xlabsep{\axissep+\tickl+2em}


\begin{figure}
\begin{measuredfigure}
\caption{Some caption}

\def\maxy{50}
\def\miny{0}
\def\maxx{40}
\def\minx{0}
\def\xlab{x-label}
\def\ylab{y-label}

\begin{tikzpicture}[y=\plotheight/(\maxy-\miny)
        , x=\plotwidth/(\maxx-\minx)]

\useasboundingbox (\miny-\axissep,\miny-\xlabsep)
    rectangle (\maxx,\maxy);

% y-axis
\draw (\minx-\axissep,\miny) -- (\minx-\axissep,\maxy);
% y-ticks
\foreach \x/\l in {\miny,10,...,\maxy}
    {\draw (\minx,\x) ++ (-\axissep,0) -- ++ (-\tickl,0)
% y-ticklabels
        node[anchor=east] {\l};}
% y-label
    \path  (\minx-\ylabsep, {(\miny+\maxy)/2}) node[rotate=90 ,anchor=south] {\ylab};

% x-axis
\draw (\minx,\miny) ++ (0,-\axissep) -- ++ (\maxx,0);

% x-ticks
\foreach \x in {0,10,...,\maxx}
    \draw (\x, \miny) ++ (0,-\axissep) -- ++ (0, -\tickl)
% x-ticklabels
        node [anchor=north] {\x};
% x-label
    \path ({(\minx+\maxx)/2},\miny) ++ (0, -\xlabsep)
    node[anchor=north] {\xlab};


\end{tikzpicture}

\end{measuredfigure}
\end{figure}

\end{document}

答え1
不要なスペースがいくつかあります。環境%内の行の末尾に追加してくださいmeasuredfigure。
\documentclass{article}
\usepackage{tikz}
\usepackage{threeparttable}
\usepackage{calc}
\usepackage[singlelinecheck=false]{caption}
\begin{document}
\newlength\plotheight % Height of plotting area
\setlength\plotheight{.4\textwidth}
\newlength\plotwidth % Width of plotting area
\setlength\plotwidth{.7\textwidth}
\newlength\axissep % Space between plotting area and axis
\setlength\axissep{\parindent}
\newlength\tickl % Length of minor ticks
\setlength\tickl{2mm}
\newlength\ylabsep % space between plotting area and ylab
\setlength\ylabsep{\axissep+\tickl+2em}
\newlength\xlabsep % space between plotting area and ylab
\setlength\xlabsep{\axissep+\tickl+2em}
\begin{figure}
\centering% <- added code
\begin{measuredfigure}
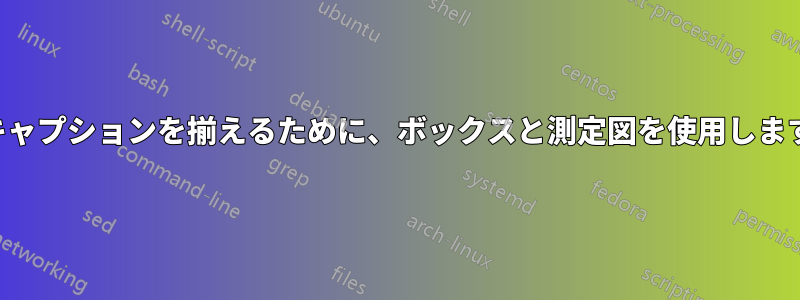
\caption{Some caption}%
%
\def\maxy{50}%
\def\miny{0}%
\def\maxx{40}%
\def\minx{0}%
\def\xlab{x-label}%
\def\ylab{y-label}%
%
\begin{tikzpicture}[y=\plotheight/(\maxy-\miny)
, x=\plotwidth/(\maxx-\minx)]
% bounding box
\useasboundingbox(\minx-\axissep,\miny-\xlabsep)
rectangle (\maxx,\maxy);
% y-axis
\draw (\minx-\axissep,\miny) -- (\minx-\axissep,\maxy);
% y-ticks
\foreach \x/\l in {\miny,10,...,\maxy}
{\draw (\minx,\x) ++ (-\axissep,0) -- ++ (-\tickl,0)
% y-ticklabels
node[anchor=east] {\l};}
% y-label
\path (\minx-\ylabsep, {(\miny+\maxy)/2}) node[rotate=90 ,anchor=south] {\ylab};
% x-axis
\draw (\minx,\miny) ++ (0,-\axissep) -- ++ (\maxx,0);
% x-ticks
\foreach \x in {0,10,...,\maxx}
\draw (\x, \miny) ++ (0,-\axissep) -- ++ (0, -\tickl)
% x-ticklabels
node [anchor=north] {\x};
% x-label
\path ({(\minx+\maxx)/2},\miny) ++ (0, -\xlabsep)
node[anchor=north] {\xlab};
% drawing the bounding box
\draw[red](current bounding box.south west)
rectangle(current bounding box.north east);
\end{tikzpicture}%
\end{measuredfigure}
\end{figure}
\end{document}
画像を中央に配置するために環境\centering内を使用していることに注意してください。境界ボックスは赤い四角形で表示されます。figure
