


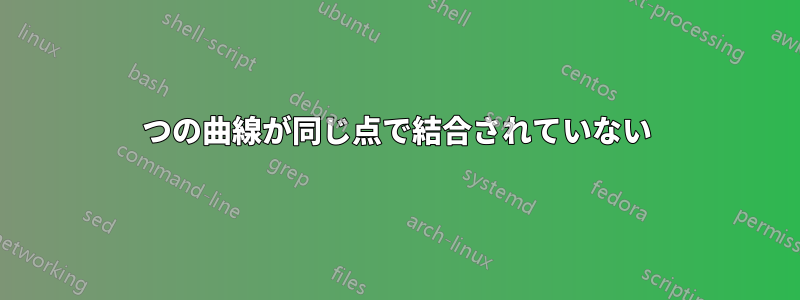
回転した楕円を表す 2 つの関数を直交座標でプロットしようとしています。しかし、この 2 つの曲線が交わる点は、「結合」または閉じているようには見えません。これを修正する方法はありますか? 原因はわかりません。
コードは次のとおりです:
\documentclass{article}

\usepackage{tikz}
\usepackage{pgfplots}

\begin{document}

\begin{tikzpicture}[scale=1]
\begin{axis}[ticks=none,
axis x line=middle,
axis y line=middle,
y axis line style={<->},
xlabel=$x$,
ylabel={$y$}
]
\addplot[-] expression[line width=0.4,smooth,samples=200,domain=0:49.999] {sqrt((1.38^(2.0)-0.5^(2.0))*(50.0*(x)-(x)^(2.0)))+0.5*(x)};
\addplot[-] expression[line width=0.4,smooth,samples=200,domain=0:49.999] {-sqrt((1.38^(2.0)-0.5^(2.0))*(50.0*(x)-(x)^(2.0)))+0.5*(x)};

\end{axis}
\end{tikzpicture}

\end{document}
助けてくれてありがとう、
答え1
正確な理由はわかりませんが、ドメインを適切に調整する必要があると思います。 を使用した (エレガントではない) 回避策を次に示しますshorten。
\documentclass[border=4]{standalone}
\usepackage{pgfplots}
\pgfplotsset{compat=1.12}
\usepgfplotslibrary{groupplots}

\begin{document}
  \begin{tikzpicture}[scale=1]
\begin{axis}[ticks=none,
axis x line=middle,
axis y line=middle,
y axis line style={<->},
xlabel=$x$,
ylabel={$y$}
]
\addplot[shorten >= -0.5ex,smooth,line width=0.4pt,samples=300,domain=0:49.99999999999999999999] {sqrt((1.38^(2.0)-0.5^(2.0))*(50.0*(x)-(x)^(2.0)))+0.5*(x)};
\addplot[shorten >= -0.5ex,smooth,line width=0.4pt,samples=300,domain=0:49.99999999999999999999] {-sqrt((1.38^(2.0)-0.5^(2.0))*(50.0*(x)-(x)^(2.0)))+0.5*(x)};
\end{axis}
\end{tikzpicture}
\end{document}

答え2
パラメータ変数(例では t)を使用してプロットを行うこともできます。利点は、ポイントがより均等に分散されるため、必要なサンプルが少なくなり、パスを閉じることができることです(smooth cycle)。
\documentclass{article}
\usepackage{tikz}
\usepackage{pgfplots}

\begin{document}
\begin{tikzpicture}[scale=1]
  \begin{axis}[ticks=none,
    axis x line=middle,
    axis y line=middle,
    y axis line style={<->},
    xlabel=$x$,
    ylabel={$y$}
  ]
    \def\xzero{25}
    \def\yzero{12.5}
    \def\RotPhi{66}
    \def\RadiusA{36.5}
    \def\RadiusB{22}
    \addplot[
      line width=.4,
      smooth cycle,
      variable=t,
      samples=100,
      domain=0:360,
    ] ({
      \xzero + \RadiusA*cos(\RotPhi)*cos(t) - \RadiusB*sin(\RotPhi)*sin(t)
    }, {
      \yzero + \RadiusA*sin(\RotPhi)*cos(t) + \RadiusB*cos(\RotPhi)*sin(t)
    })
    ;
  \end{axis}
\end{tikzpicture}
\end{document}
