


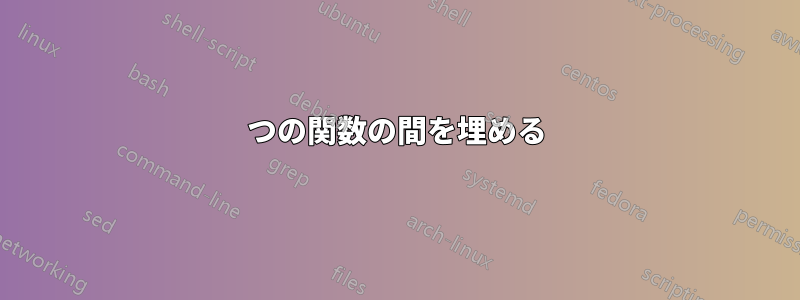
以下の例では、波のプロファイルと船のプロファイルの間の陰影が付いた画像 (成功) と、喫水線と\zeta=0歪んだ水中の船体プロファイルの間の陰影が付いた画像 (失敗) の 2 つの画像を提示しようとしています。...同じ構文を使用しfill between、多くの投稿を精査しましたが、エラーが見つからないようです...誰かに明らかなのでしょうか?
% Hull Mapping Diagram
% Author: Richard W. Greenwood
\documentclass{article}
\usepackage{tikz}
\usepackage{pgfplots}
%%%<
\usepackage{verbatim}
\usepackage[active,tightpage]{preview}
\usetikzlibrary{calc}
\usepackage{amssymb}
\PreviewEnvironment{tikzpicture}
\setlength{\PreviewBorder}{10pt}%
%%%>
\usepackage{pgfplots}
\pgfplotsset{compat=1.11}
\usepgfplotslibrary{fillbetween}
\usetikzlibrary{patterns}
\usetikzlibrary{intersections}
\pgfdeclarelayer{bg}
\pgfsetlayers{bg,main}


\begin{document}


\begin{comment}
:Title: Hull Mapping
:Author: Richard W. Greenwood
\end{comment}

\pgfmathdeclarefunction{wave}{0}{\pgfmathparse{-0.25*cos(\x r)}}
\pgfmathdeclarefunction{tr_wave}{0}{\pgfmathparse{0}}
\pgfmathdeclarefunction{deck}{0}{\pgfmathparse{0.5}}
\pgfmathdeclarefunction{tr_deck}{0}{\pgfmathparse{0.5+0.25*cos(\x r)}}
\pgfmathdeclarefunction{buttock}{0}{\pgfmathparse{-0.5-0.125*(\x)}}
\pgfmathdeclarefunction{skeg}{0}{\pgfmathparse{-8.2-3.9*(\x)}}
\pgfmathdeclarefunction{keel}{0}{\pgfmathparse{-0.5}}
\pgfmathdeclarefunction{stem}{0}{\pgfmathparse{-10.5+3.5*(\x)}}

\pgfplotsset{width=10cm, compat=1.10}

\begin{tikzpicture}
[declare function={keelp(\x)=
(\x>=0.94*pi)*(-10.5+3.5*(\x))+and
(\x>-0.66*pi,\x<0.94*pi)*(-0.5)+
(\x<=-0.66*pi)*(-0.5+\x*-0.125);}]

[yscale=1.0]
\begin{axis}[
    axis equal image,
    xtick       = \empty,
    ytick       = \empty,
    axis lines =middle,
    samples     = 160,
    domain      = -1.5*pi:1.5*pi,
    xmin = -1.3*pi, xmax = 1.4*pi,
    ymin = -0.75, ymax = 1.35,
    title style={at={(0.5,-0.2)},anchor=north},
 title = actual immersed hull surface,
  ]
\addplot[name path=keelprofile, red,domain={-pi:pi}]{keelp(x)};
\addplot[name path=wave, blue, thick, domain={-1.25*pi:1.25*pi} ] {wave};
%\addplot[name path=tr_wave, blue, thick, domain={-1.25*pi:1.25*pi} ] {tr_wave};
%\addplot[name path=tr_profile, green, thick, domain={-pi:0.97*pi} ] {-(wave-keelprofile(x))};
%\addplot[name path=tr_deck, green, thin, mark=none, domain={-1.*pi:1.*pi}] {tr_deck};
\addplot[name path=deck, red, thin, mark=none, domain={-1.*pi:1.*pi}] {deck};
\addplot[name path=transom,red, thin] coordinates {(-pi,-0.1)(-pi,0.5)};
\addplot[black, thin] coordinates {(0,-0.75)(0,0.9)}node[anchor=south west,black]{$z$};
\addplot[black, thin] coordinates {(-1.3*pi,0)(1.35*pi,0)}node[anchor=south,black]{$x$};
\addplot [pattern=north west lines, pattern color=brown!50]fill between[ of = wave and keelprofile, soft clip={domain=-pi:0.97*pi}];
  \end{axis}
\end{tikzpicture}

\begin{tikzpicture}
[declare function={
keelp(\x)=
(\x>=0.94*pi)*(-10.5+3.5*(\x))+and
(\x>-0.66*pi,\x<0.94*pi)*(-0.5)+
(\x<=-0.66*pi)*(-0.5+\x*-0.125);
trp(\x)=
(\x>=0.94*pi)*(-10.5+3.5*(\x)+0.25*cos(\x r))+and
(\x>-0.66*pi,\x<0.94*pi)*(-0.5+0.25*cos(\x r))+
(\x<=-0.66*pi)*(-0.5+\x*-0.125+0.25*cos(\x r));
}]
[yscale=1.0]
\begin{axis}[
    axis equal image,
    xtick       = \empty,
    ytick       = \empty,
    axis lines =middle,
    samples     = 160,
    domain      = -1.5*pi:1.5*pi,
    xmin = -1.3*pi, xmax = 1.4*pi,
    ymin = -0.75, ymax = 1.35,
    title style={at={(0.5,-0.2)},anchor=north},
 title = transformed immersed hull surface,
  ]
\addplot[name path=tr_wave, blue, thick, domain={-1.25*pi:1.25*pi} ] {tr_wave};
%\addplot[name path=tr_profile, red, thin, domain={-pi:pi} ] {keelp(x)-wave};
\addplot[name path=trp, red, thin, domain={-pi:pi} ] {trp(x)};
\addplot[name path=tr_deck, red, thin, mark=none, domain={-1.*pi:1.*pi}] {tr_deck};
\addplot[name path=tr_transom,red, thin] coordinates {(-pi,-0.35)(-pi,0.25)};
\addplot[black, thin] coordinates {(0,-0.75)(0,0.9)}node[anchor=south west,black]{$\xi$};
\addplot[black, thin] coordinates {(-1.3*pi,0)(1.35*pi,0)}node[anchor=south,black]{$x$};
\addplot [pattern=north west lines, pattern color=brown!50]fill between[ of = tr_wave and trp, soft clip={domain=-pi:0.97*pi}];
  \end{axis}
\end{tikzpicture}

\end{document}

答え1
更新された回答
報告されたバグは修正され、PGFPlots v1.16 のリリースにより、あなたの例では期待どおりの結果が直接得られます。
元の回答
これはすでに報告されているバグPGFPlots でfill betweenを と一緒に使用するとsoft clip、軸の境界に達します。したがって、解決方法は簡単です。ymin値を など、より低い値に設定する-0.76と、目的の結果が得られます。
ここでは、コードの関連部分の結果のみを示します (さらに、この奇妙な動作がどこから来ているのかを証明するための追加情報も示します)。
% used PGFPlots v1.14
\documentclass[border=5pt]{standalone}
\usepackage{pgfplots}
    \usetikzlibrary{
        patterns,
        pgfplots.fillbetween,
    }
    \pgfplotsset{
        compat=1.11,
        width=10cm,
    }
    \pgfmathdeclarefunction{tr_wave}{0}{\pgfmathparse{0}}
\begin{document}
    \begin{tikzpicture}[
        declare function={
            trp(\x) =
                (\x>=0.94*pi)*(-10.5+3.5*(\x)+0.25*cos(\x r))
                + and(\x>-0.66*pi,\x<0.94*pi)*(-0.5+0.25*cos(\x r))
                + (\x<=-0.66*pi)*(-0.5+\x*-0.125+0.25*cos(\x r))
            ;
        },
    ]
        \begin{axis}[
            axis equal image,
            xtick=\empty,
            ytick=\empty,
            axis lines =middle,
            samples=160,
            xmin=-1.3*pi,
            xmax=1.4*pi,
            % -----------------------------------------------------------------
            % that is the important line here
            % it is equal or greater than the minimum value of one of the
            % `fill between' pathes and thus causes the strange behaviour
            % in combination with the `soft clip' path
            ymin=-0.76,         % <-- changed from -0.75
            % -----------------------------------------------------------------
            ymax=1.35,
            title style={
                at={(0.5,-0.2)},
                anchor=north,
            },
            title=transformed immersed hull surface,
        ]
            \addplot [
                name path=tr_wave,
                blue,
                thick,
                domain={-1.25*pi:1.25*pi},
            ] {tr_wave};
            \addplot [
                name path=trp,
                red,
                thin,
                domain={-pi:pi},
            ] {trp(x)};

            \addplot [
                pattern=north west lines,
                pattern color=brown!50,
            ] fill between [
                of=tr_wave and trp,
                % to prove that the soft clip is responsible for the bug
                % use e.g. a `ymin' value between -0.70 and -0.75,
                % comment the `soft clip' path and you will get the desired result
                soft clip={
                    domain=-pi:0.97*pi,
%                    % comment the previous line and use the next one which
%                    % should give the same result as when no `soft clip` path
%                    % is used
%                    % (same domain as `tr_wave')
%                    domain=-1.25*pi:1.25*pi,
                },
            ];

            % this line shows you the previous `ymin' and that it touched one
            % of the pathes relevant for the `fill between'
            \draw [help lines, dashed]
                (\pgfkeysvalueof{/pgfplots/xmin},-0.75)
                -- (\pgfkeysvalueof{/pgfplots/xmax},-0.75)
            ;
        \end{axis}
    \end{tikzpicture}
\end{document}
