


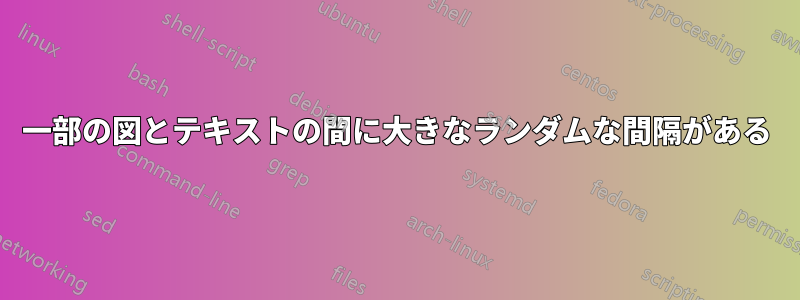
ドキュメントの最初のページは問題ありませんが、何らかの理由で 2 ページ目のテキストと図の間にランダムなスペースがいっぱいあります。
問題を解決できるかどうか調べてみましたが、何も機能しませんでした。正直なところ、何が間違っているのか全くわかりません。
\documentclass[11pt,a4paper,twocolumn]{paper}
\usepackage[T1]{fontenc}
\usepackage[latin1,utf8]{inputenc}
\usepackage[none]{hyphenat}

\usepackage{lmodern}
\usepackage{makeidx}
\usepackage[pdftex]{graphicx}

\usepackage[english]{babel}

\usepackage{amsmath,amssymb,amsthm}
\usepackage{mathrsfs}
\usepackage{mathtools}
\usepackage{grffile}

\usepackage{bbm}
\usepackage{dsfont}

\usepackage[]{subfigure}

\usepackage{verbatim}

\usepackage{color}
\usepackage{hyperref}

\usepackage{accents}
\usepackage{textcomp}
\usepackage{multirow}
\usepackage{booktabs}
\usepackage{float}

\setlength{\columnsep}{30pt}

\usepackage[compact]{titlesec}
\titlespacing{\section}{0pt}{*0}{*0}
\titlespacing{\subsection}{0pt}{*0}{*0}
\titlespacing{\subsubsection}{0pt}{*0}{*0}

\usepackage{geometry}
\geometry{a4paper,left=25mm,right=25mm, top=25mm, bottom=25mm}

\begin{document}

\section*{Materials $\&$ Methods}


\subsection*{Equipment $\&$ setup}

\noindent{The equipment used to complete the experiment included a multimeter, a soldering iron and some solder, 243 1k$\Omega$ (resistors with a tolerance of 5$\%$) and a circuit board. To start the resistance of a single resistor was measured using the multimeter and compared to the theoretical value of the resistor.}


\noindent{Next the first generation gasket, ($n=0$), was created using three resistors soldered into an equilateral triangle, see figure \ref{figure 1}, making sure the positioning of the resistors gave enough space to complete up to a fourth generation. The theoretical resistance across AB was then calculated and compared to the measured resistance across AB, AC and BC.}


\begin{figure}[H]
\begin{center}
\includegraphics[width=0.9\linewidth]{gen1.jpg}
\caption{First generation of a Sierpinski gasket}
\label{figure 1}
\end{center}
\end{figure}

\noindent{The second generation, ($n=1$), added an additional 6 resistors resulting in 3 first generation gaskets soldered together at their corners as seen in figure \ref{figure 2}. The theoretical resistance across AB' was calculated, using the $\Delta$ to $Y$ transformation, and then compared to the measured resistance across AB', AC' and B'C'.}

\begin{figure}[H]
\begin{center}
\includegraphics[width=0.9\linewidth]{gen2.jpg}
\caption{Second generation of a Sierpinski gasket}
\label{figure 2}
\end{center}
\end{figure}

\noindent{The third generation, ($n=2$), required a further additional 18 resistors resulting in 3 second generation gaskets soldered together at their corners, in a similar fashion to generation 2 , as seen in figure \ref{figure 3}. The theoretical resistance across AB'' was calculated and then compared to the measured resistance across AB'', AC'' and B''C''.}

\begin{figure}[H]
\begin{center}
\includegraphics[width=0.9\linewidth]{gen3.jpg}
\caption{Third generation of a Sierpinski gasket}
\label{figure 3}
\end{center}
\end{figure}

\noindent{The final generation to be completed on the single circuit board was the fourth generation, ($n=3$), and required a total of 81 resistors. They were soldered together to form what looked like 3 third generation gaskets soldered at their corners, as seen in figure \ref{figure 4}. The theoretical resistance across AB''' was calculated again and then compared to the measured resistance across AB''', AC''' and B'''C'''.}

\begin{figure}[H]
\begin{center}
\includegraphics[width=0.9\linewidth]{gen4.jpg}
\caption{Fourth generation of a Sierpinski gasket}
\label{figure 4}
\end{center}
\end{figure}

\noindent{Now that the circuit board had no room left on it to expand to a fifth generation gasket, ($n=4$), we combined our fourth generation gasket with 2 other groups. We did this through the use of crocodile clips and circuit leads to connect them into a large equilateral triangle AB''''C''''. The theoretical resistance across AB'''' was calculated and then compared to the measured resistance across AB'''', AC'''', B''''C''''.}

\subsection*{Data collection}

To measure the resistance of each generation we attached a multimeter across the gasket, using crocodile clips and circuit leads, from one corner of the triangle to another. This gave three values of resistance for each generation. The measured resistances were noted down into small tables for each generations. A summary table was then created to, make it easier to read the data, generalising a notation that the top point of the gasket as A, the bottom left as B and the bottom right as C. The table also included the theoretical resistance, $R_T$, the mean resistance, $R_{mean}$, and the number of resistors from A to B, which would all be needed later for the plotting of a graph.

\section*{Results}
\subsection*{Calculations $\&$ errors}
\section*{Discussion}
\section*{Conclusion}[![enter image description here][1]][1]

\end{document}
コードには最初のページのテキストと図は含まれません。
私は、すべてのテキストをページの左側の 1 つの大きな段落に移動し、画像を右側に配置することでこの問題を解決しました。次に、画像のサイズを縮小して、すべての画像が 1 ページに収まるようにしました。
答え1
私は以下の変更を行います
- 上記のコメントで提案されているよう
[H]にオプションを置き換えます[htb] - 置き換える(下記のMWE
\begin<{center} ... \end{center}を\centering参照) - すべて削除し
\noindent{...}、代わりに前文での使用を定義する\setlength\parindent{0pt} subfigure廃止されたパッケージの代わりにsubfighyperrefパッケージをプリアンブルの最後に移動します。
この変更後、次のようになります:
\documentclass[11pt,a4paper,twocolumn]{paper}
\usepackage[T1]{fontenc}
\usepackage{inputenc}

\usepackage{lmodern}
\usepackage{makeidx}
\usepackage[demo]{graphicx}

\usepackage[english]{babel}
\usepackage[none]{hyphenat}% without this package the result is even better

%\usepackage{amsmath,amssymb,amsthm}
%\usepackage{mathrsfs}
%\usepackage{mathtools}
%\usepackage{grffile}

%\usepackage{bbm}
%\usepackage{dsfont}

\usepackage[]{subfigure}

\usepackage{verbatim}

\usepackage{color}

\usepackage{accents}
\usepackage{textcomp}
\usepackage{multirow}
\usepackage{booktabs}
%\usepackage{float}

\setlength{\columnsep}{30pt}

\usepackage[compact]{titlesec}
\titlespacing{\section}{0pt}{*0}{*0}
\titlespacing{\subsection}{0pt}{*0}{*0}
\titlespacing{\subsubsection}{0pt}{*0}{*0}

\usepackage{geometry}
\geometry{a4paper,left=25mm,right=25mm, top=25mm, bottom=25mm}
\setlength\parindent{0pt}

\usepackage{hyperref}

\begin{document}

\section*{Materials $\&$ Methods}


\subsection*{Equipment $\&$ setup}

The equipment used to complete the experiment included a multimeter, a soldering iron and some solder, 243 1k$\Omega$ (resistors with a tolerance of 5$\%$) and a circuit board. To start the resistance of a single resistor was measured using the multimeter and compared to the theoretical value of the resistor.


Next the first generation gasket, ($n=0$), was created using three resistors soldered into an equilateral triangle, see figure \ref{figure 1}, making sure the positioning of the resistors gave enough space to complete up to a fourth generation. The theoretical resistance across AB was then calculated and compared to the measured resistance across AB, AC and BC.


\begin{figure}[htb]
\centering
\includegraphics[width=0.9\linewidth]{gen1.jpg}
\caption{First generation of a Sierpinski gasket}
\label{figure 1}
\end{figure}

The second generation, ($n=1$), added an additional 6 resistors resulting in 3 first generation gaskets soldered together at their corners as seen in figure \ref{figure 2}. The theoretical resistance across AB' was calculated, using the $\Delta$ to $Y$ transformation, and then compared to the measured resistance across AB', AC' and B'C'.

\begin{figure}[htb]
\centering
\includegraphics[width=0.9\linewidth]{gen2.jpg}
\caption{Second generation of a Sierpinski gasket}
\label{figure 2}
\end{figure}

The third generation, ($n=2$), required a further additional 18 resistors resulting in 3 second generation gaskets soldered together at their corners, in a similar fashion to generation 2 , as seen in figure \ref{figure 3}. The theoretical resistance across AB'' was calculated and then compared to the measured resistance across AB'', AC'' and B''C''.

\begin{figure}[htb]
\centering
\includegraphics[width=0.9\linewidth]{gen3.jpg}
\caption{Third generation of a Sierpinski gasket}
\label{figure 3}
\end{figure}

The final generation to be completed on the single circuit board was the fourth generation, ($n=3$), and required a total of 81 resistors. They were soldered together to form what looked like 3 third generation gaskets soldered at their corners, as seen in figure \ref{figure 4}. The theoretical resistance across AB''' was calculated again and then compared to the measured resistance across AB''', AC''' and B'''C'''.

\begin{figure}[htb]
\centering
\includegraphics[width=0.9\linewidth]{gen4.jpg}
\caption{Fourth generation of a Sierpinski gasket}
\label{figure 4}
\end{figure}

Now that the circuit board had no room left on it to expand to a fifth generation gasket, ($n=4$), we combined our fourth generation gasket with 2 other groups. We did this through the use of crocodile clips and circuit leads to connect them into a large equilateral triangle AB''''C''''. The theoretical resistance across AB'''' was calculated and then compared to the measured resistance across AB'''', AC'''', B''''C''''.

\subsection*{Data collection}

To measure the resistance of each generation we attached a multimeter across the gasket, using crocodile clips and circuit leads, from one corner of the triangle to another. This gave three values of resistance for each generation. The measured resistances were noted down into small tables for each generations. A summary table was then created to, make it easier to read the data, generalising a notation that the top point of the gasket as A, the bottom left as B and the bottom right as C. The table also included the theoretical resistance, $R_T$, the mean resistance, $R_{mean}$, and the number of resistors from A to B, which would all be needed later for the plotting of a graph.

\section*{Results}
\subsection*{Calculations $\&$ errors}
\section*{Discussion}
\section*{Conclusion}

\end{document}
