


次の mwe は、pgfgantt パッケージの誤用です。これは、より大きなタスクを構成するさまざまなサブタスクの相対的な労力や、各サブタスクの完了状態などを示すことを目的としています。個々のサブタスクのタイミングを無視して、メイン タスクの全体的な完了状態を示すことを目的としています。
個々のサブタスクの進行状況を示すラベルの位置を改善するのに時間を費やしましたが、あまり効果はありませんでした。
進捗ラベルを画面の中央の下または上に配置する方法に関する提案全体サブタスク(完了/未完了の境界ではないもの)も歓迎します。
\NeedsTeXFormat{LaTeX2e}
\documentclass[12pt]{standalone}
\usepackage{pgfgantt}
\usepackage{times}

\definecolor{teal}{rgb}{0,0.57,0.81}%
\definecolor{aqua}{rgb}{0.51,0.81,0.79}%
\definecolor{blue_gray}{rgb}{0.36,0.52,0.63}%

% create a new command for a ganttbar entry
\newcommand{\ganttbarentryprogresscustom}[5]{%
\ganttbar[progress=#1,%
bar/.append style={pattern color = #2},%
bar progress label anchor=south,%
bar inline label node/.style={above=3pt}]%
{#3}{#4}{#5}%
}%

\begin{document}
\begin{ganttchart}[%
x unit=1.4cm,%
y unit chart=1.1cm,%
time slot unit=day,%
bar/.append style={pattern=north west lines, pattern color = cyan},%
inline%
]{0}{11}%
\ganttgroup[inline=false]{Task 1}{1}{10}\\%
\ganttbarentryprogresscustom{100}{blue_gray}{Subtask 1}{1}{6}
\ganttbarentryprogresscustom{90}{teal}{Subtask 2}{7}{8}%
\ganttbarentryprogresscustom{75}{aqua}{Subtask 3}{9}{10}%
\end{ganttchart}
\end{document}
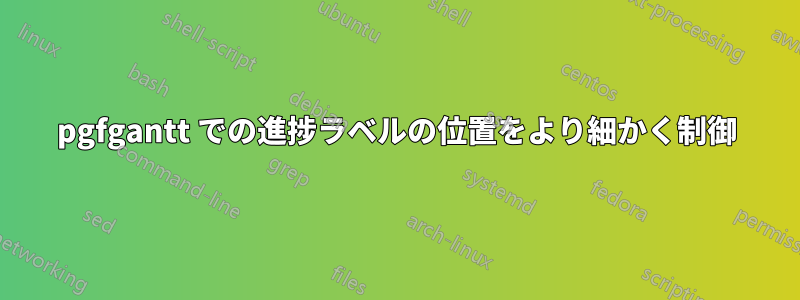
出力は次のようになります。

答え1
を加えるとbar progress label node/.append style={anchor=north,yshift=0.2em},、
\NeedsTeXFormat{LaTeX2e}
\documentclass[12pt]{standalone}
\usepackage{pgfgantt}
\usepackage{times}

\definecolor{teal}{rgb}{0,0.57,0.81}%
\definecolor{aqua}{rgb}{0.51,0.81,0.79}%
\definecolor{blue_gray}{rgb}{0.36,0.52,0.63}%

% create a new command for a ganttbar entry
\newcommand{\ganttbarentryprogresscustom}[5]{%
\ganttbar[progress=#1,%
bar/.append style={pattern color = #2},%
bar progress label anchor=south,%
bar progress label node/.append style={anchor=north,yshift=0.2em},
bar inline label node/.style={above=3pt}]%
{#3}{#4}{#5}%
}%

\begin{document}
\begin{ganttchart}[%
x unit=1.4cm,%
y unit chart=1.1cm,%
time slot unit=day,%
bar/.append style={pattern=north west lines, pattern color = cyan},%
inline%
]{0}{11}%
\ganttgroup[inline=false]{Task 1}{1}{10}\\%
\ganttbarentryprogresscustom{100}{blue_gray}{Subtask 1}{1}{6}
\ganttbarentryprogresscustom{90}{teal}{Subtask 2}{7}{8}%
\ganttbarentryprogresscustom{75}{aqua}{Subtask 3}{9}{10}%
\end{ganttchart}
\end{document}
