


%E3%82%92%E3%83%97%E3%83%AD%E3%83%83%E3%83%88%E3%81%99%E3%82%8B.png)
\begin{document}

\begin{tikzpicture}
    \begin{axis}
        \addplot{cot(deg(x))};
    \end{axis}
\end{tikzpicture}

\end{document}
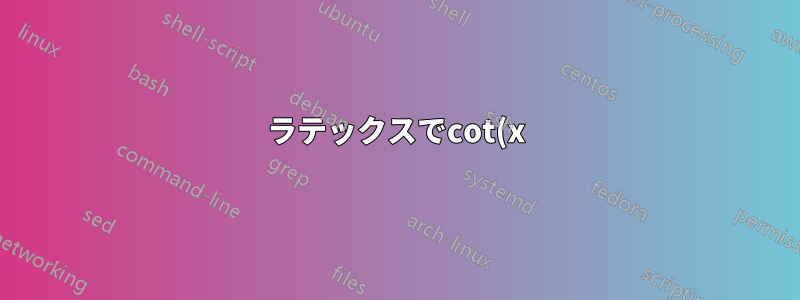
上記のコードを使用してcot(x)をプロットしようとしましたが、次のようなグラフが表示されます。

何が悪かったのか?
答え1
単純に、サンプリングされるポイントが足りません。
\documentclass[tikz]{standalone}
    \usepackage{pgfplots}
    \begin{document}
    \begin{tikzpicture}
        \begin{axis}
            \addplot[domain=0:360,samples=361]{cot(x)};
        \end{axis}
    \end{tikzpicture}
\end{document}

編集: 例の y 軸のスケールが $n\cdot10^4$ と指定されていることに気付きました。この問題のより詳しい説明は、デフォルトのサンプリングで $0$ に非常に近い点が選択されたため、その点の $\cot(x)$ の値が非常に大きくなり、他のすべてが x 軸に非常に近くなるということです。同様の効果がここでも発生します:
\documentclass[tikz]{standalone}
    \usepackage{pgfplots}
    \begin{document}
    \begin{tikzpicture}
        \begin{axis}
            \addplot[domain=-5:5,samples=1024]{cot(x)};
        \end{axis}
    \end{tikzpicture}
\end{document}

将来このような問題を回避するには、システムが関数の極値付近をサンプリングするような不測の事態が発生するかどうかを検討してください。