


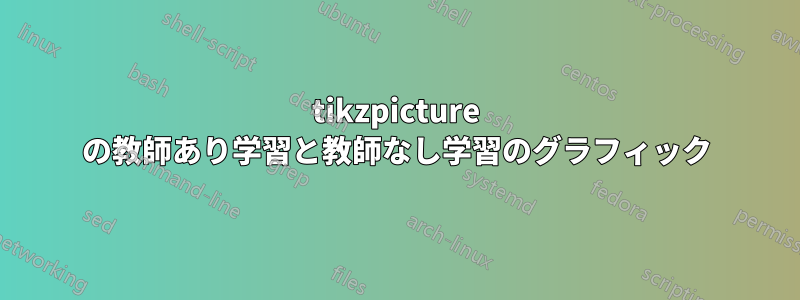
これら 2 つのプロットを を使用して表したいと思いますtikzpicture。以下のように結合する必要はありませんが、似たようなものを作成したいと思います。

以下のように散布図を生成できます。

2 つのユニークで異なるクラスターがあります。教師あり学習の例のように線形に分離可能な線を描画し、教師なし学習の例のクラスターも描画したいと思います。
さらに、色やポイントが大きいとさらに良いでしょう。
コード:
\documentclass{article}
\usepackage{pgfplots}
\begin{document}
\begin{tikzpicture}
\begin{axis}[%
axis lines = left,
xlabel = x,
ylabel = y,
]
\addplot[only marks] table [%
x = x,
y = y,
col sep = comma]{
    x, y
    %cluster 1
    2, 3
    3, 5
    4, 5
    3, 8
    5, 9
    3, 2
    5, 6
    6, 6
    7, 9
    10, 4
    11, 5
    9, 4
    %cluser 2

    20, 10
    21, 12
    24, 12
    25, 13
    27, 14
    22, 13
    23, 15
    25, 10
    15, 14
 };
\end{axis}
\end{tikzpicture}
\end{document}
答え1
scatter/classesを使用して 2 つのクラスターのポイントを別々にフォーマットすることもできますが、 を 2 つに分割する方が簡単です\addplot。フォーマットを設定するには、たとえば を使用します\addplot [blue, only marks, mark=*, mark size=5] ...。これは、ほとんど説明不要だと思います。
線と円については、通常の TikZ コマンドを使用するのとほぼ同じです。ただし、デフォルトでは、環境\draw (x,y) ..内でを実行するとaxis、の座標系には含まれないことに注意してください。xyaxisない限りa) を使用するか(axis cs:x,y)、b) \pgfplotsset{compat=1.11}(またはより高いバージョン番号)を追加します。後者の場合はaxis csがデフォルトになります。
さらに、 のcircle[radius=2]内側に がaxis必要ですcompat=1.11(と思う) が、半径は軸座標にあるため、この場合は楕円になります。代わりに、 の内側に座標を定義しaxis、その外側に円を描くこともできます。どちらも以下のコードで示されています。

\documentclass{article}
\usepackage{pgfplots}
\pgfplotsset{compat=1.11} % <-- added
\begin{document}
\begin{tikzpicture}
\begin{axis}[%
axis lines = left,
xlabel = $x$,
ylabel = $y$,
clip mode=individual % so things drawn by \draw and similar are not cut off
]
\addplot [blue, only marks, mark=*, mark size=5] table [%
x = x,
y = y,
col sep = comma]{
    x, y
    %cluster 1
    2, 3
    3, 5
    4, 5
    3, 8
    5, 9
    3, 2
    5, 6
    6, 6
    7, 9
    10, 4
    11, 5
    9, 4
    };

\addplot+[red, only marks, mark=*, mark size=5] table [%
x = x,
y = y,
col sep = comma]{
    x, y
    20, 10
    21, 12
    24, 12
    25, 13
    27, 14
    22, 13
    23, 15
    25, 10
    15, 14
 };

 % to be able to use axis coordinates with \draw directly you need
 % \pgfplotsset{compat=1.11} or a higher version
 % if that is not present, use (axis cs:4,14) instead of (4,14),
 % to specify that the values should be interpreted as axis coordinates
 \draw [dashed] (4,14) -- (25,2);

 % save a coordinate for use later
 \coordinate (c2) at (23,12);

 % the blue circle is drawn inside the axis environment, and in axis coordinates
 % hence it becomes an ellipse
 \draw [blue, dashed] (6,6) circle[radius=5];

\end{axis}

% the red circle is drawn outside the axis, so actually looks like a circle,
% but the radius has no relation to the axis coordinates
\draw [red, dashed] (c2) circle[radius=2cm];
\end{tikzpicture}
\end{document}
2つの軸
2 つのプロットを隣り合わせに表示するには、複数の方法があります。 を 2 つtikzpicture続けて追加するか、axis同じ に 2 つの環境を用意してtikzpicture、2 つ目の環境を を使用して配置することができます。個人的には、軸のグリッドを作成するためのライブラリの環境\begin{axis}[at={(x,y)},...が気に入っています。groupplotgroupplots

\documentclass{article}
\usepackage{pgfplots}
\usepgfplotslibrary{groupplots}
\pgfplotsset{compat=1.11}
\begin{document}
\begin{tikzpicture}
\begin{groupplot}[
group style={
  group size=2 by 1,
  horizontal sep=1.5cm
  },
axis lines = left,
xlabel = $x$,
ylabel = $y$,
width=5cm, % <-- set size of axes
clip mode=individual, % to avoid \draws being cut off
title style={yshift=1mm, font=\bfseries\sffamily}
]

\nextgroupplot[title=Supervised learning]
\addplot [blue, only marks, mark=*, mark size=3] table [%
x = x,
y = y,
col sep = comma]{
    x, y
    %cluster 1
    2, 3
    3, 5
    4, 5
    3, 8
    5, 9
    3, 2
    5, 6
    6, 6
    7, 9
    10, 4
    11, 5
    9, 4
    };

\addplot+[red, only marks, mark=*, mark size=3] table [%
x = x,
y = y,
col sep = comma]{
    x, y
    20, 10
    21, 12
    24, 12
    25, 13
    27, 14
    22, 13
    23, 15
    25, 10
    15, 14
 };

 % to be able to use axis coordinates with \draw directly you need
 % \pgfplotsset{compat=1.11} or a higher version
 % if that is not present, use (axis cs:4,14) instead of (4,14),
 % to specify that the values should be interpreted as axis coordinates
 \draw [dashed] (4,14) -- (25,2);


\nextgroupplot[title=Unsupervised learning]
\addplot [blue, only marks, mark=*, mark size=3] table [%
x = x,
y = y,
col sep = comma]{
    x, y
    %cluster 1
    2, 3
    3, 5
    4, 5
    3, 8
    5, 9
    3, 2
    5, 6
    6, 6
    7, 9
    10, 4
    11, 5
    9, 4
    };

\addplot+[red, only marks, mark=*, mark size=3] table [%
x = x,
y = y,
col sep = comma]{
    x, y
    20, 10
    21, 12
    24, 12
    25, 13
    27, 14
    22, 13
    23, 15
    25, 10
    15, 14
 };


 % save a coordinate for use later
 \coordinate (c2) at (23,12);

 % the blue circle is drawn inside the axis environment, and in axis coordinates
 % hence it becomes an ellipse
 \draw [blue, dashed] (6,6) circle[radius=5];

\end{groupplot}

% the red circle is drawn outside the axis, so actually looks like a circle,
% but the radius has no relation to the axis coordinates
\draw [red, dashed] (c2) circle[radius=1cm];


\end{tikzpicture}
\end{document}