


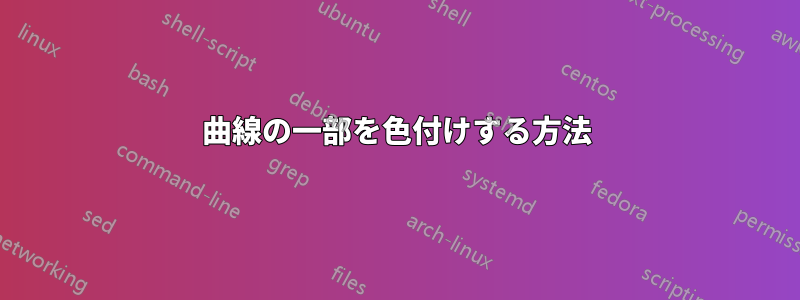
図のように曲線の一部を色付けしたいのですが、次のコードを使用しました。
\documentclass{article}
\usepackage{tikz,amsmath, amssymb,bm,color}
\usetikzlibrary{calc}
\usetikzlibrary{intersections}
\usetikzlibrary{shapes,arrows,arrows.meta,angles,quotes,patterns,patterns.meta}
\begin{document}
    \begin{tikzpicture}[>=stealth']
        %\tikzstyle{every node}=[font=\footnotesize]

        \draw[->](-0.5,1.5)--(9.5,1.5) node[right]{$u$};
        \draw[->](0,-2)--(0,4.75) node[left]{$v$};

        \draw [thick] plot [domain=0:2](0.5,2.5)
        .. controls ++(60:2.5) and ++(120:1.5) .. (3.5,3.5)
        .. controls ++(-60:1) and ++(-120:1) .. (5,3.5)
        .. controls ++(60:1.5) and ++(120:1.5) .. (7,2.5)
        .. controls ++(-60:1) and ++(-160:1) .. (9,2);
        \begin{scope}[yscale=-1,shift={(0,-3)}]
            \draw [thick] (0.5,2.5)
            .. controls ++(60:2.5) and ++(120:1.5) .. (3.5,3.5)
            .. controls ++(-60:1) and ++(-120:1) .. (5,3.5)
            .. controls ++(60:1.5) and ++(120:1.5) .. (7,2.5)
            .. controls ++(-60:1) and ++(-160:1) .. (9,2);
        \end{scope}
    \end{tikzpicture}
\end{document}

答え1
1つの選択肢は、上に別の曲線を描くことです(@hpekristiansen のコメントに基づいて更新し、いくつかのクリーンアップを行いました):
\documentclass{article}
\usepackage{tikz,amsmath, amssymb,bm,color}
\usetikzlibrary{calc}
\usetikzlibrary{intersections}
\usetikzlibrary{shapes,arrows,arrows.meta,angles,quotes,patterns,patterns.meta}

\begin{document}
    \begin{tikzpicture}[>=stealth', remember picture, overlay]
       \tikzstyle{reverseclip}=[
            insert path={
                (current page.north east)
                -- (current page.south east)
                -- (current page.south west)
                -- (current page.north west)
                -- (current page.north east)
            }
        ];

        \tikzset{
            myCurve/.pic={
                .code={
                    \draw [thick] plot [domain=0:2] (0.5,2.5)
                    .. controls ++(60:2.5) and ++(120:1.5) .. (3.5,3.5)
                    .. controls ++(-60:1) and ++(-120:1) .. (5,3.5)
                    .. controls ++(60:1.5) and ++(120:1.5) .. (7,2.5)
                    .. controls ++(-60:1) and ++(-160:1) .. (9,2);
                }
            }
        }
        \draw[->](-0.5,1.5)--(9.5,1.5) node[right]{$u$};
        \draw[->](0,-2)--(0,4.75) node[left]{$v$};

        \coordinate (B) at (4,5);
        \coordinate (E) at (7,-5);

        \begin{scope}
            \clip[reverseclip] (B) rectangle (E);
            \path (0, 0) pic {myCurve};
        \end{scope}

        \begin{scope}
            \clip (B) rectangle (E);
            \path[red] (0, 0) pic {myCurve};
        \end{scope}

        \begin{scope}[shift={(0,3)}]
            \path (0, 0) pic[yscale=-1] {myCurve};
        \end{scope}

    \end{tikzpicture}
\end{document}
