


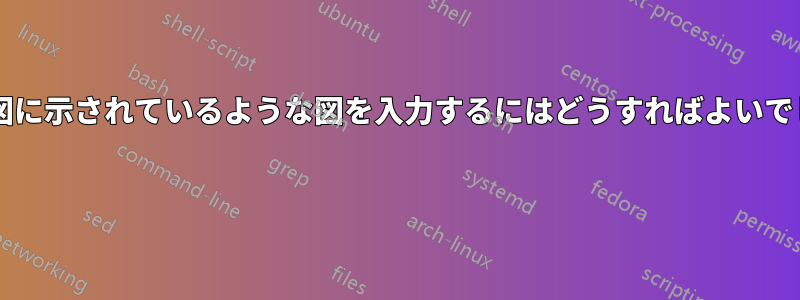

このような図を、必ずしも点 (V_2、P_5、T_5) などではなく、線分を使用して再作成するにはどうすればよいですか。
答え1
いくつかのコメントにもあるように、まずはあなた自身の試みを見てみたいと思います。しかし、この図には興味深い側面がいくつか含まれているため、最終的な図への道筋をスケッチします。ちなみに、これは多かれ少なかれ図面を作成するための手順です。
詳細はここをクリック
Tikzマニュアルのチュートリアルセクションをざっと目を通すか、または読むことをお勧めします。htmlのpdf. また、私が使用している関連するすべての Tikz コマンドを調べます。
基本的な考え方
まず基本的な考え方を見てみましょう。
- 軸を描く
- 下の曲線を描く
- 点を打つために必要なポイントを示す
- 下の曲線の上の点を結ぶ
斧: 彼女には何も奇妙なことはありません...ただ描くだけです。
    % ~~~ axes ~~~
    \draw[->] (0,0) -- (5,0);
    \draw[->] (0,0) -- (0,5);
さて、下の曲線は複雑に見えますが、Tikz のパスの概念を理解していればそうではありません。基本的には、2 つの点の間に線を描きます\draw (1,3) -- (4,1);。曲線にするには、 を--に置き換えてto[out=,in=]、出射角と入射角を指定するのが 1 つの方法です。パスは で始まり\draw、 で終わります;。それでは、パスが終了する前に、このパスでもう少し操作を実行してみましょう。node最後に描いた座標の後に を置いて、T1 ラベルを配置します。node開始点と終了点の間に をさらに 2 つ挿入します。ここでは、それらの座標 (A) と (B) のみを使用し、 を使用してこのパス上の位置を微調整します。パス内に[pos=]ドロップされた に注意してください。\
    % ~~~ lower curve: a path with many actions ~~~~~
    \draw (1,3) to[out=-60,in=170]  % start point, towards ...
    node[pos=.8] (A) {A}            % basically, store coordinates
    node[pos=.6] (B) {B}            % (A) and (B)
    (4,1) node[anchor=west]{$T_1$}  % end point + some node as label
    ;                               % end of this path
(B)の上にもう一つの点(C)が必要なので、別の\node点を置きます。[yshift=]
    % ~~~ put a node//coordinate above (B) ~~~
    \node (C) at ([yshift=6mm]B) {C};
最後に、(A)、(C)、(B) を再び曲線で結びます。
    % ~~~ connect A, C and B ~~~~~~~~~
    \draw (A) to[out=140,in=-70] (C) -- (B);

改良点
変更点と追加点は次のとおりです。
- いくつかのスタイルを定義します。
crdダミーノードを円でレンダリングし、ln線を描画します。 coordinate (X)後でX軸に沿って覚えておく- ノードA、B、Cからテキストを削除し、
crdスタイルを使用する - 矢印とラベルを描いて
(label) - (B)の座標(V4)を(X)を再利用して計算し、チェックマークを付けます
\node。\draw
行内のについては、 shifted arrowいくつかの方法があります。私は遅延バリアントを使用しましたが、さらに次のオプションがあります。
- 矢印を省略する
- デコレーションライブラリの使用
- AとBの間に中間点を置く(必要に応じて角度を調整する)
- 等

完全なコード
このコードは、ページ ジオメトリを調整した図面の 2 つのページ (tikzpicture 環境ごとに 1 つ) を作成します。
\documentclass[10pt,border=3mm,tikz]{standalone}

\begin{document}
 % ~~~ (I) basic ideas ~~~~~~~~~~~~~~~
 \begin{tikzpicture}
    % ~~~ axes ~~~
    \draw[->] (0,0) -- (5,0);
    \draw[->] (0,0) -- (0,5);

    % ~~~ lower curve: a path with many actions ~~~~~
    \draw (1,3) to[out=-60,in=170]  % start point, towards ...
    node[pos=.8] (A) {A}            % basically, store coordinates
    node[pos=.6] (B) {B}            % (A) and (B)
    (4,1) node[anchor=west]{$T_1$}  % end point + some node as label
    ;                               % end of this path

    % ~~~ put a node//coordinate above (B) ~~~
    \node (C) at ([yshift=6mm]B) {C};

    % ~~~ connect A, C and B ~~~~~~~~~
    \draw (A) to[out=140,in=-70] (C) -- (B);

 \end{tikzpicture}


 % ~~~ (II) fine print ~~~~~~~~~~~~~~~
 \begin{tikzpicture}[   % some self-defined styles
    crd/.style={minimum size=1mm,       % puts the dots
                inner sep=0pt,circle,draw,fill},
    ln/.style={blue, line width=1.5pt},
 ]
    % ~~~ axes ~~~
    \draw[->] (0,0) -- (5,0) coordinate (X);
    \draw[->] (0,0) -- (0,5);

    % ~~~ lower curve: a path with many actions ~~~~~
    \draw (1,3) to[out=-60,in=170]  % start point, towards ...
    node[pos=.8,crd] (A) {}         % basically, store coordinates
    node[pos=.6,crd] (B) {}         % (A) and (B)
    (4,1) node[anchor=west]{$T_1$}  % end point + some node as label
    ;                               % end of this path

    % ~~~ put a node//coordinate above (B) ~~~
    \node[crd] (C) at ([yshift=6mm]B) {};

    % ~~~ connect A, C and B ~~~~~~~~~
    \draw[ln,->] (A) to[out=140,in=-70] (C);
    \draw[ln]    (C) -- (B);

    % ~~~ put some label ~~~~~~~~~~~
    \draw[<-] (C) -- +(45:15mm) node[anchor=west] {$(V_4, P_4, T_4)$};

    % ~~~ perpendicular below points ~~~~~~~
    \coordinate           (V4) at (B |- X); % projection onto x-axis
    \node[yshift=-3mm] at (V4) {$V_4$};     % the label
    \draw (V4) -- +(0,.2);                  % the tick

 \end{tikzpicture}
\end{document}