


読みにくいと思いますpgfplots マニュアル、たとえば、詳細情報を含むアンカー ノードなど、参照できるエンティティ。
たとえば、以下の例では、参照できるエンティティの一部またはすべては何ですか?
\documentclass[10pt,border=3mm,tikz]{standalone}
\usepackage{pgfplots}

\begin{document}
 \begin{tikzpicture}
    \begin{axis}[
        title=hello,
        xlabel=x,
     ]
        \addplot[domain=-1:1]   {(x-.2)^3 + 1};

        \addplot[domain=-1:1]   {x+1.5};
    \end{axis}
 \end{tikzpicture}
\end{document}

答え1
簡単に言えば、少なくとも以下を参照できます。
- エンティティには、
name= current axis、current plot beginなどの定義済みエンティティcurrent plot end
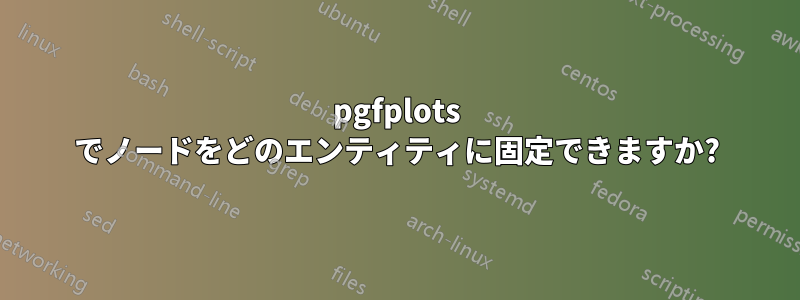
以下の例を参照してください。注記ノードの順序と配置が関係する可能性があることに注意してください。current plot ...例を参照してください。注記ノードで使用されるさまざまなスタイルオプション。詳細については、pgfplots マニュアル。
% ~~~ 10.04.2024: Where can I name things like a node? ~~~~~~~~~

\documentclass[10pt,border=3mm,tikz]{standalone}
\usepackage{pgfplots}

\begin{document}
 \begin{tikzpicture}
    \begin{axis}[
        name=AX,                    % <<<
        title=hello,                % not here
        title style={name=TS},      % <<<
        xlabel=x,                   % not here
        xlabel style={name=XL},     % <<<
        ylabel=y,                   % not here
        ylabel style={name=YL},     % <<<
     ]
     \addplot[
        domain=-1:1,
        %name path=CRV, % needs fill between
        %name=AP,       % no
     ]{(x-.2)^3 + 1};

     \addplot[domain=-1:1,]{x+1.5};

    \end{axis}

    % ~~~ current axis ~~~~~~~~~~~~~~~~~~~~~~~~~~~~~~~~~~~~~~~~~~~~~
    \node[anchor=west,red,circle,draw]  at (current axis.east)  {CA};

    % ~~~ current plot ~~~~~~~~~~~~~~~~~~~~~~~~~~~~~~~~~~~~~~~~~~~~
    \node[red,circle,draw]              at (current plot begin) {CPb};
    \node[red,circle,draw]              at (current plot end)   {CPe};

    % ~~~ named axis, see above ~~~~~~~~~~~~~~~~~~~~~~~~~~~~~~~~~~~~
    \node[anchor=west,teal]     at (AX.south east)      {AX};
    \node[anchor=east,teal]     at (AX.north west)      {AX};
    \node[teal]                 at (AX.outer north west){AX};
    \node[teal]                 at (AX.origin)          {AXorg};
    \node[teal]                 at (AX.center)          {AXcnt};

    % ~~~ named styles ~~~~~~~~~~~~~~~~~~~~~~~~~~~~~~~~~~~~~~~~~~~~~
    \node[anchor=west,purple,draw]  at (TS.east)    {TS};
    \node[anchor=west,purple,draw]  at (XL.east)    {XL};
    \node[anchor=west,purple,draw]  at (YL.east)    {YL};
 \end{tikzpicture}
\end{document}
