


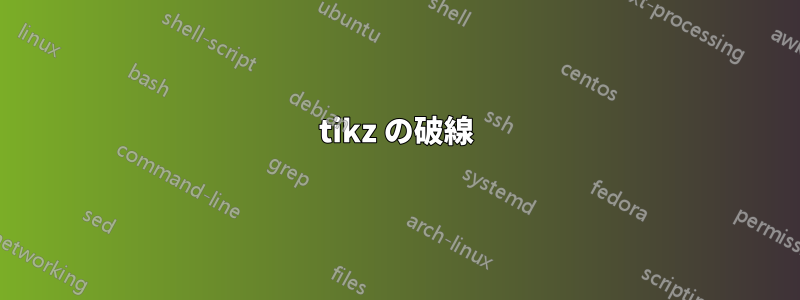
この図のコードを書いたのですが、この2つのダッシュをどのように追加すればよいでしょうか

\documentclass{article}
\usepackage{tikz}
\usetikzlibrary{arrows,positioning,fit}
\usetikzlibrary{arrows,calc,positioning}
\usetikzlibrary{shapes,arrows,positioning,calc}
\begin{document}
    \newlength\estilength
    \settowidth\estilength{$estimator$}
    \tikzset{
        block/.style = {draw, fill=white, rectangle, minimum height=3em, minimum width=3em,text width=\estilength,align=center},
        tmp/.style  = {coordinate},
        sum/.style= {draw, fill=white, circle, node distance=1cm},
        input/.style = {coordinate},
        output/.style= {coordinate},
        pinstyle/.style = {pin edge={to-,thin,black}
        },
        point/.style = {draw, fill=black, circle, minimum size=0.8mm, node distance=1.5cm, inner sep=0pt},
        dashed node/.style={draw,dashed,inner sep=7.5pt,rounded corners},
    }%
    \begin{tikzpicture}[auto, node distance=15mm,>=latex']
        \node [input, name=input] {};

        \node [block, right=of input] (plant) {$controller$};


    \end{tikzpicture}
\end{document}
答え1
やり方はこうです。
特にTikz初心者の場合は、ステップバイステップで実行し、コメントで私の数字を見て、不完全に結構です(十分です)。
私のコメントを超えたいくつかの意見:
- 絶対座標を使用すると初心者はより細かく制御できます。後で
positioningライブラリや他のツールに移行する可能性があります。 - 常にシンプルに
\draw (A) -- (B);(例:直線)から始め、後で洗練します\draw (A) |- (B);(例:垂直接続、次に水平接続) - スタイルを使用してコードを読みやすくする
- 中間点を導入する(例:相対座標
+()または新しい絶対++()座標) - Tikzはパスの概念を使用しており、構文的には で始まり
\、 で終わり;、その間のアクションを実行します。 - そのため、パスが終わる前にラベルを配置するために
node(!なしで)を置くことができます。\ anchorノードから参照を変更するには、使用するのが便利ですcenter- 極座標は、のような座標として
(45:1)、またはノードの形の周りの座標として、あなたの味方になります。(A.north) == (A.90)
幸運を祈ります。これらのコマンドをtikz マニュアル並行して。

\documentclass[10pt,border=3mm,tikz]{standalone}
% ~~~ (4) replace arrow tip ~~~~~~~~~~
\usetikzlibrary{arrows.meta}

\begin{document}
 \begin{tikzpicture}[ % ~~~ (2) doing some style ~~~
    blk/.style={draw,minimum height=1cm,minimum width=3cm},
    LL/.style={line width=3pt, draw=blue!70!green!40},
    >={Triangle}, % ~~~ (4) replace arrow tip ~~~~~~~~~~
 ]
    % ~~~ (1) putting a node ~~~~~~~~
    \node[blk] (C) at (0,0) {controller};

    % ~~~ (3) drawing the blue line ~~~~~~
    \draw[->,LL]  (6,1.5) -| (C);

    % ~~~ (5) left indicator ~~~~~~~~~~~~
    \draw[dashed] (C.120) -- ++(100:3) -- +(-4,0)
            node[anchor=south west] {distributed controller};

    % ~~~ (6) right indicator ~~~~~~~~~~~~
    \draw[dashed] (2,1.5) -- ++(45:2) -- +(4,0)
            node[anchor=south east] {communication topology}
            node[anchor=north east,pos=.6] {delay}
            ;
 \end{tikzpicture}
\end{document}