


私はLaTeXとTikZを初めて使います。
プロジェクトのさまざまな並行ステップを表すさまざまな色のテキストが書かれたタイムラインを描く必要があります。
これが私のコードです:
\documentclass{standalone}

\usepackage{tikz}

\begin{document}
\begin{tikzpicture}[%
    every node/.style={
        font=\scriptsize,
        % Better alignment, see https://tex.stackexchange.com/questions/315075
        text height=1ex,
        text depth=.25ex,
    },
]

% draw horizontal line
\draw[-] (0,0) -- (15,0);

% draw vertical lines
\foreach \x in {0,1.25,...,15}{
    \draw (\x cm,3pt) -- (\x cm,0pt);
}

\foreach \x in {0,5,...,15}{
    \draw (\x cm,3pt) -- (\x cm,8pt);
}

% place axis labels
\node[anchor=north] at (0,0) {Sep. 2024};
\node[anchor=north] at (2.5,0) {T3};
\node[anchor=north] at (5,0) {Sep. 2025};
\node[anchor=north] at (7.5,0) {T7};
\node[anchor=north] at (10,0) {Sep. 2026};
\node[anchor=north] at (12.5,0) {T11};
\node[anchor=north] at (15,0) {Sep. 2027};

% Text markers
\draw[color=black, thick] (0,0.4) -- (0,0.7) node[above, text=blue] {Step 1};
\draw[color=black, thick] (7.5,0.2) -- (7.5,0.5) node[above, text=orange] {Example};
\draw[color=black, thick] (12.5,0.2) -- (12.5,0.5) node[above, text=ForestGreen] {Enseignement};
\draw[color=black, thick] (1.25, -0.2) -- (1.25, -0.5) node[below, text=blue] {I would like a list here With different colors};


% Legend
\node[draw, circle, fill=blue, inner sep=1pt, label={right:Valorisation}] at (4,-2) {};
\node[draw, circle, fill=orange, inner sep=1pt, label={right:Recherche}] at (6.5,-2) {};
\node[draw, circle, fill=ForestGreen, inner sep=1pt, label={right:Enseignement}] at (9,-2) {};

\end{tikzpicture}
\end{document}
問題が2つあります。
まず、各ティックにリストとして複数のエントリを書くことはできますが、行を区切る方法がわかりません。たとえば、2番目のティックでは、
"I would like a list here
 With different colors"
\\中括弧内で「 」を使用しようとしましたが、TeX はそれを認識しません。
また、リストの異なるエントリに異なる色を使用できるようにしたいのですが、入力できる色は 1 つだけのように感じます。たとえば、「ここにリストを置きたい」という表現は青にし、「異なる色で」という表現はオレンジにしたいのです。
それは可能ですか?
答え1
使用する場合、ノード テキストでalign=center使用できます。\\
色を区別するには、オプション\textcolor{<color>}{<text>}を使用する代わりに、ノード内でを使用しますtext。
\documentclass{standalone}
\usepackage[dvipsnames]{xcolor}
\usepackage{tikz}

\begin{document}
\begin{tikzpicture}[%
    every node/.style={
        font=\scriptsize,
        % Better alignment, see https://tex.stackexchange.com/questions/315075
        text height=1ex,
        text depth=.25ex,
    },
]

% draw horizontal line
\draw[-] (0,0) -- (15,0);

% draw vertical lines
\foreach \x in {0,1.25,...,15}{
    \draw (\x cm,3pt) -- (\x cm,0pt);
}

\foreach \x in {0,5,...,15}{
    \draw (\x cm,3pt) -- (\x cm,8pt);
}

% place axis labels
\node[anchor=north] at (0,0) {Sep. 2024};
\node[anchor=north] at (2.5,0) {T3};
\node[anchor=north] at (5,0) {Sep. 2025};
\node[anchor=north] at (7.5,0) {T7};
\node[anchor=north] at (10,0) {Sep. 2026};
\node[anchor=north] at (12.5,0) {T11};
\node[anchor=north] at (15,0) {Sep. 2027};

% Text markers
\draw[color=black, thick] (0,0.4) -- (0,0.7) node[above, text=blue] {Step 1};
\draw[color=black, thick] (7.5,0.2) -- (7.5,0.5) node[above, text=orange] {Example};
\draw[color=black, thick] (12.5,0.2) -- (12.5,0.5) node[above, text=ForestGreen] {Enseignement};
\draw[color=black, thick] (1.25, -0.2) -- (1.25, -0.5) node[below=3.5mm, align=center] {\textcolor{blue}{I would like a list here}\\ \textcolor{orange}{With different colors}};


% Legend
\node[draw, circle, fill=blue, inner sep=1pt, label={right:Valorisation}] at (4,-2) {};
\node[draw, circle, fill=orange, inner sep=1pt, label={right:Recherche}] at (6.5,-2) {};
\node[draw, circle, fill=ForestGreen, inner sep=1pt, label={right:Enseignement}] at (9,-2) {};

\end{tikzpicture}
\end{document}

答え2
解決
以下に、実行できるいくつかの方法を示します。他にも実行できる方法があるかもしれません。いくつか注意点があります。
- 欠けている部分を追加しました
- コードのノイズが減りました ;-)
- 何らかの理由でその
every node発言が問題を引き起こしたので、今のところ削除しました - ノードテキストを分割する方法はいくつかあります。
text widthその1つは、ノードテキストのpgfmanual - 私はそれを別のスタイルとして導入した
runtxt - ここで興味のあるノードに名前を付けると
(A)、物事が簡単になります - 擬似コディッシュ(A.南をB.北の上に)をアンカーするだけです
- リストのような通常のLaTeXテキストを中に入れる
- デフォルトでは、途切れることなく中央に配置されています
選択してください。ただし、まだやるべきことがいくつかあります。
- 凡例の位置 ( として配置することもできます
\pic) - あなたの
every nodeスタイルを使用するには少なくともレビューが必要です
一般的な提案
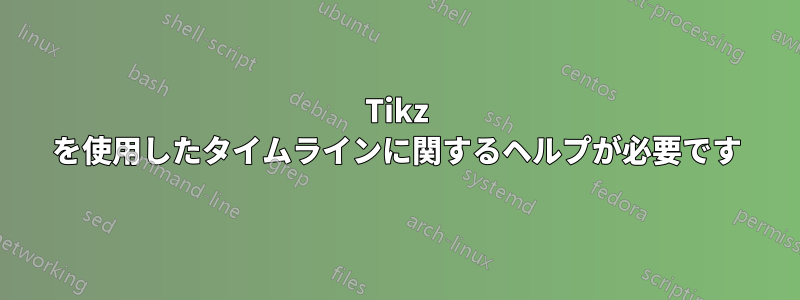
一般的に言って、私はこのような図をやり過ぎないようにします。ガントチャート、Tikz 上に構築されていますか?
表示部分で本当に処理しなければならないことがたくさんある場合は、プロジェクト管理ソフトウェアを覗いてみるのもいいかもしれません。MS-Officeの世界にない場合は、ワークベンチを開く一見の価値があるかもしれない(https://sourceforge.net/projects/openworkbench/)。// Open Workbench の画像検索については、以下のスクリーンショットを参照してください。

\documentclass[border=3mm]{standalone}
\usepackage[dvipsnames]{xcolor} % <<<

\usepackage{tikz}

\begin{document}
 \begin{tikzpicture}[%
%       every node/.style={
%           font=\scriptsize,
%           % Better alignment, see https://tex.stackexchange.com/questions/315075
%           text height=1ex,
%           text depth=.25ex,
%       },
        runtxt/.style={text width=25mm},    % <<<
    ]

    % draw horizontal line
    \draw[-] (0,0) -- (15,0);

    % draw vertical lines
    \foreach \x in {0,1.25,...,15}{
        \draw (\x cm,3pt) -- (\x cm,0pt);
    }

    \foreach \x in {0,5,...,15}{
        \draw (\x cm,3pt) -- (\x cm,8pt);
    }

    % place axis labels
    \node[anchor=north] at (0,0) {Sep. 2024};
    \node[anchor=north] at (2.5,0) {T3};
    \node[anchor=north] at (5,0) {Sep. 2025};
    \node[anchor=north] at (7.5,0) {T7};
    \node[anchor=north] at (10,0) {Sep. 2026};
    \node[anchor=north] at (12.5,0) {T11};
    \node[anchor=north] at (15,0) {Sep. 2027};

    % Text markers
    \draw[color=black, thick]
                            (0,0.4) -- (0,0.7)
                            node[above, text=blue] {Step 1};
    \draw[color=black, thick]
                            (7.5,0.2) -- (7.5,0.5)
                            node[above, text=orange] {Example};
    \draw[color=black, thick]
                            (12.5,0.2) -- (12.5,0.5)
                            node[above, text=ForestGreen] {Enseignement};
    \draw[color=black, thick,runtxt]                % <<<
                            (1.25, -0.2) -- (1.25, -0.5)
                            node[below, text=blue] (A)
                                {I would like a
                                list here With different colors};

    % ~~~ demonstrating some options ~~~~~~~
    \node[anchor=north,runtxt,teal] (B) at (A.south){
        \begin{itemize}         % use regular LaTeX, BUT NO \tikz
         \item if you like it
         \item and you want it
         \item put a list on it
        \end{itemize}
    };
    \node[anchor=north,red] (C1) at (B.south) {
        This could be the first row
    };
    \node[anchor=north,red!100!orange!50,fill=yellow!20] (C2) at (C1.south) {
        of your list
    };

    % Legend
    \node[draw, circle, fill=blue, inner sep=1pt, label={right:Valorisation}] at (4,-2) {};
    \node[draw, circle, fill=orange, inner sep=1pt, label={right:Recherche}] at (6.5,-2) {};
    \node[draw, circle, fill=ForestGreen, inner sep=1pt, label={right:Enseignement}] at (9,-2) {};

 \end{tikzpicture}
\end{document}
Open Workbench についての印象:
