


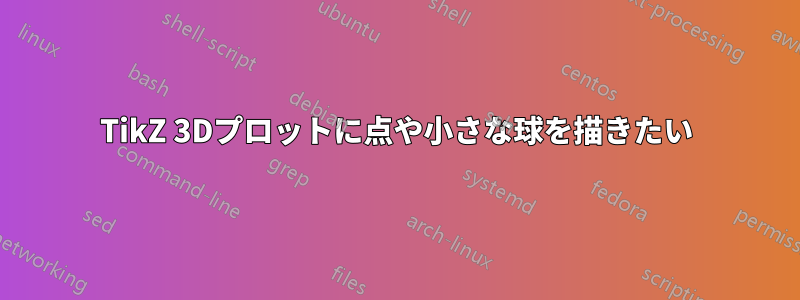
3D 座標系を取得して、点をドットでマークしたいと思います。
\begin{tikzpicture}[x = {(0.866cm,0.5cm)}, y={(0cm,1cm)}, z={(0.866cm,-0.5cm)},]
\draw[thick,->] (-15,0,0) -- (15,0,0) node[right] {x};
\draw[thick,->] (0,-12,0) -- (0,12,0) node[above] {y};
\draw[thick,->] (0,0,-15) -- (0,0,50) node[right] {z};
\fill (0,0,5) circle (1);
\end{tikzpicture}
結果は次のとおりです。

しかし、私が欲しいのは、次の観点から見ると球体または円です。

どうすればこれを実現できるでしょうか?
答え1
典型的には、インターネットで 2 時間検索します。そして、ようやく投稿してから 2 分後には、自分で答えを見つけます。しかし、見つけるのがとても大変だったので、他の誰かの役に立つかもしれません。
\begin{tikzpicture}[x = {(0.866cm,0.5cm)}, y={(0cm,1cm)}, z={(0.866cm,-0.5cm)},]
\draw[thick,->] (-15,0,0) -- (15,0,0) node[right] {x};
\draw[thick,->] (0,-12,0) -- (0,12,0) node[above] {y};
\draw[thick,->] (0,0,-15) -- (0,0,50) node[right] {z};
\draw plot [mark=*, mark size=10] coordinates{(0,0,5)};
\end{tikzpicture}
どのように動作するのかは分かりませんが、私が望んでいたことは完璧に実現されています。

答え2
tikz-3dplotここでは、サイズを変更できる球と円の両方を表示するソリューションを示します。

コード
\documentclass[border=1cm]{standalone}
\usepackage{tikz}
\usepackage{tikz-3dplot}

\tdplotsetmaincoords{120}{50}

\begin{document}

\begin{tikzpicture}[scale=2, tdplot_main_coords,axis/.style={->},thick]
\draw[axis] (-1, 0, 0) -- (1, 0, 0) node [right] {$X$};
\draw[axis] (0, -1, 0) -- (0, 3, 0) node [right] {$Z$};
\draw[axis] (0, 0, -1) -- (0, 0, 1) node [above] {$Y$};

\node[draw=none,shape=circle,fill, inner sep=2pt] (d1) at (0,1,0){};  % circle

\tdplottransformmainscreen{0}{2}{0}
\shade[tdplot_screen_coords, ball color = red] (\tdplotresx,\tdplotresy) circle (0.05);                                                                   % sphere
\end{tikzpicture}
\end{document}
答え3
nodeポイントを入れるのに使えます。
線の上に点を置きたい場合はマークを使用するのが最適ですが、線の外側に点を置きたい場合は...
\documentclass[tikz, varwidth, border=10]{standalone}
\begin{document}
  \begin{tikzpicture}[scale=.2, x = {(0.866cm,0.5cm)}, y={(0cm,1cm)}, z={(0.866cm,-0.5cm)}]
    \draw[thick,->] (-15,0,0) -- (15,0,0) node[right] {x};
    \draw[thick,->] (0,-12,0) -- (0,12,0) node[above] {y};
    \draw[thick,->] (0,0,-15) -- (0,0,50) node[right] {z};
    \path (0,0,5) node[circle, fill, inner sep=1]{};
    \path (1,0,5) node[circle, fill, inner sep=1]{};
  \end{tikzpicture}
\end{document}

注: 読むことができますこの質問/回答。