


Estoy trabajando en un lstlistingentorno personalizado, en el que uso TikZ para agregar un marco y un título. Debido a las llaves generalizadas de nodeno puedo usar newenvironment, así que tengo que recurrir a NewEnviron.
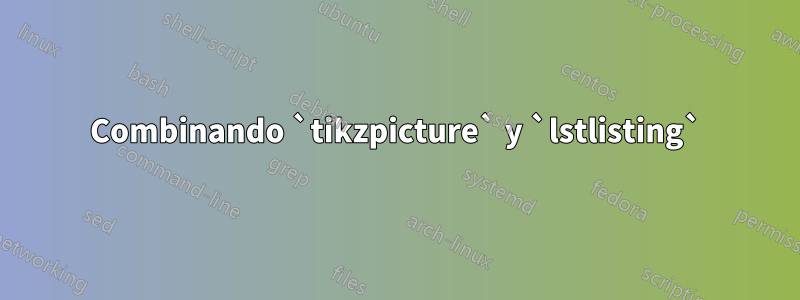
A partir del MWE y la imagen a continuación debería quedar claro lo que estoy tratando de lograr:
\documentclass[a4paper,11pt]{article}

\usepackage{listings}
\lstset{breaklines=true, postbreak={\mbox{$\hookrightarrow\space$}}, language=Mathematica}

\usepackage{tikz}
\usetikzlibrary{shapes,decorations}

\tikzstyle{boxround} = [draw=black, thick, rectangle, rounded corners, inner sep=10pt, inner ysep=20pt]
\tikzstyle{head} =[draw=black, fill=white, thick, rectangle]

\usepackage{environ}

\NewEnviron{code}{%
\bigskip
\noindent\begin{tikzpicture}
\node [boxround] (box){%
\begin{minipage}{.94\textwidth}
\BODY
\end{minipage}};
\node[head, right=10pt] at (box.north west) {\textbf{Code listing}};
\end{tikzpicture}
\bigskip
}

\begin{document}

\begin{code}
How to get some \textsc{Mathematica} code (shown below) in this box...
\end{code}

\footnotesize
\begin{lstlisting}
B11[x_, y_] = Piecewise[{{1, 0 <= x <= 1 && 0 <= y <= 1}}];
Plot3D[B11[x, y], {x, -.5, 1.5}, {y, -.5, 1.5}, PlotRange -> Full];
\end{lstlisting}
\normalsize

\end{document}
Lo que resulta en

Si no fuera por tikzpicture, simplemente usaría lstnewenvironment. Pero considerando las llaves generalizadas de nodeno sé cómo podría hacerlo. ¿Algunas ideas?
Respuesta1
Aquí una sugerencia con mdframed:
\documentclass{article}

\usepackage{libertine}
\usepackage[T1]{fontenc}
\usepackage{listings}
\lstset{basicstyle=\footnotesize\ttfamily,breaklines=true, postbreak={\mbox{$\hookrightarrow\space$}}, language=Mathematica}

\usepackage[framemethod=TikZ]{mdframed}

\mdfdefinestyle{lstlisting}{%
 innertopmargin=5pt,
 middlelinewidth=1pt,
 outerlinewidth=9pt,outerlinecolor=white,
 innerleftmargin=10pt,
 innerrightmargin=10pt,
 leftmargin=-9pt,rightmargin=-9pt,
 skipabove=\topskip,
 skipbelow=\topskip,
 roundcorner=5pt,
 singleextra={\node[draw, fill=white,anchor=west, xshift=10pt+1pt,font=\bfseries] at (O|-P) {Code Listings};},
 firstextra={\node[draw, fill=white,anchor=west, xshift=10pt+1pt,font=\bfseries] at (O|-P) {Code Listings};}
}

\lstnewenvironment{code}{%
  \mdframed[style=lstlisting]%
}{\endmdframed}

\begin{document}
Text
\begin{code}
B11[x_, y_] = Piecewise[{{1, 0 <= x <= 1 && 0 <= y <= 1}}];
Plot3D[B11[x, y], {x, -.5, 1.5}, {y, -.5, 1.5}, PlotRange -> Full];
\end{code}
\end{document}

Actualizar
En el siguiente ejemplo, tiene un nuevo entorno denominado codeque tiene un argumento opcional y otro obligatorio. Se pasa el argumento opcional \lstsety el obligatorio es el título.
\documentclass{article}

\usepackage{libertine}
\usepackage[T1]{fontenc}
\usepackage{listings}
\lstset{basicstyle=\footnotesize\ttfamily,breaklines=true, postbreak={\mbox{$\hookrightarrow\space$}}, language=Mathematica}

\usepackage[framemethod=TikZ]{mdframed}

\makeatletter
\def\mdf@@codeheading{Code Listings}%new mdframed key:
\define@key{mdf}{title}{%
   \def\mdf@@codeheading{#1}
}

\mdfdefinestyle{lstlisting}{%
 innertopmargin=5pt,
 middlelinewidth=1pt,
 outerlinewidth=9pt,outerlinecolor=white,
 innerleftmargin=10pt,
 innerrightmargin=10pt,
 leftmargin=-9pt,rightmargin=-9pt,
 skipabove=\topskip,
 skipbelow=\topskip,
 roundcorner=5pt,
 singleextra={\node[draw, fill=white,anchor=west, xshift=10pt+1pt,font=\bfseries] at (O|-P) {\csname mdf@@codeheading\endcsname};},
 firstextra={\node[draw, fill=white,anchor=west, xshift=10pt+1pt,font=\bfseries] at (O|-P) {\csname mdf@@codeheading\endcsname};}
}

\lstnewenvironment{code}[2][]{%
  \lstset{#1}%
  \mdframed[style=lstlisting,title={#2}]%
}{\endmdframed}

\begin{document}
Text

\begin{code}{Mathematice Listings}
B11[x_, y_] = Piecewise[{{1, 0 <= x <= 1 && 0 <= y <= 1}}];
Plot3D[B11[x, y], {x, -.5, 1.5}, {y, -.5, 1.5}, PlotRange -> Full];
\end{code}

Text

\begin{code}{Code Listings}
B11[x_, y_] = Piecewise[{{1, 0 <= x <= 1 && 0 <= y <= 1}}];
Plot3D[B11[x, y], {x, -.5, 1.5}, {y, -.5, 1.5}, PlotRange -> Full];
\end{code}
\end{document}
Respuesta2
Aquí una sugerencia usandotcolorbox
\documentclass{article}
\usepackage{libertine}
\usepackage[T1]{fontenc}
\usepackage{tikz}
\usepackage{tcolorbox}
\tcbuselibrary{listings}
\tcbuselibrary{skins}

\newenvironment{code}{%
  \tcblisting{listing only,colback=white,enlarge top by=5.5mm,enhanced,%
     overlay={\node[draw,fill=white,xshift=10pt,right,font=\bfseries] at (frame.north west) {Code Listings};},%
     listing options={basicstyle=\footnotesize\ttfamily,breaklines=true,%
                      postbreak={\mbox{$\hookrightarrow\space$}},language=Mathematica},%
  }%
 }%
 {\endtcblisting}

\begin{document}
\begin{code}
B11[x_, y_] = Piecewise[{{1, 0 <= x <= 1 && 0 <= y <= 1}}];
Plot3D[B11[x, y], {x, -.5, 1.5}, {y, -.5, 1.5}, PlotRange -> Full];
\end{code}

\end{document}
