


LaTeX의 가장자리와 노드 목록 위에 그래프 표현이 있는 그림을 보여주고 싶습니다. 나는 다음과 같은 것을 썼습니다 :
\begin{figure}[!ht]

\subfloat[First figure]{
\centering
\begin{tikzpicture}[>=stealth', shorten >=1pt, auto, node distance=3cm,
                thick, main node/.style={circle,draw,font=\sffamily\Large\bfseries}]

\node[main node] (v1) at (-2,2) {2};
\node[main node] (v2) at (2,2) {3};
\node[main node] (v3) at (4,0) {6};
\node[main node] (v4) at (2,-2) {4};
\node[main node] (v5) at (-2,-2) {5};
\node[main node] (v6) at (-4,0) {1};
\draw  (v1) edge (v2);
\draw  (v2) edge (v3);
\draw  (v3) edge (v4);
\draw  (v4) edge (v5);
\draw  (v5) edge (v6);
\draw  (v6) edge (v1);
\draw  (v5) edge (v1);
\draw  (v5) edge (v2);
\draw  (v4) edge (v2);
\end{tikzpicture}
}

\subfloat[Second figure]{
$V(G) = \{1, 2, 3, 4, 5, 6\}$
$E(G) = \{(1, 2), (2, 1), (1, 5), (5, 1), (2, 5), (5, 2), (2, 3), (3, 2), (5, 3), (3, 5), (5, 4), (4, 5), (3, 4), (4, 3), (3, 6), (6, 3), (4, 6), 6, 5)\}$
}
\caption[Graph representation]{Graph representation.}
\label{fig:graphexample}

\end{figure}
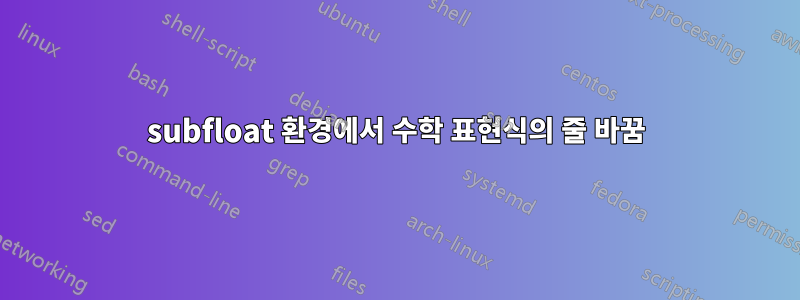
출력 http://imageshack.com/a/img196/7216/y3ms.png
내 문제는 두 번째 하위 그림 환경의 E(G)에 대한 수학 표현식이 너무 긴 경우 여러 줄에 걸쳐 표시되기를 원한다는 것입니다. 가능하다면 "두 번째 그림"이라는 캡션도 페이지 중앙에 표시하고 싶습니다.
내 문제를 어떻게 해결할 수 있나요?
감사합니다.
답변1
array또 다른 대안: 두 번째 그림에 를 사용합니다 .

암호
\documentclass{article}
\usepackage{tikz,subfig}
\usetikzlibrary{arrows}

\begin{document}

\begin{figure}[!ht]
\centering
\subfloat[First figure]{
\begin{tikzpicture}[>=stealth', shorten >=1pt, auto, node distance=3cm, thick,
main node/.style={circle,draw,font=\sffamily\Large\bfseries}]
\node[main node] (v1) at (-2,2) {2};
\node[main node] (v2) at (2,2) {3};
\node[main node] (v3) at (4,0) {6};
\node[main node] (v4) at (2,-2) {4};
\node[main node] (v5) at (-2,-2) {5};
\node[main node] (v6) at (-4,0) {1};
\draw  (v1) edge (v2);
\draw  (v2) edge (v3);
\draw  (v3) edge (v4);
\draw  (v4) edge (v5);
\draw  (v5) edge (v6);
\draw  (v6) edge (v1);
\draw  (v5) edge (v1);
\draw  (v5) edge (v2);
\draw  (v4) edge (v2);
\end{tikzpicture}
}\\
\subfloat[Second figure]{$
\begin{array}{lll}
V(G) &=& \{1, 2, 3, 4, 5, 6\}\\
E(G) &=& \{(1, 2), (2, 1), (1, 5), (5, 1), (2, 5),(5, 2), \\
&&(2, 3), (3, 2), (5, 3), (3, 5), (5, 4), (4, 5),\\
&&(3, 4), (4, 3), (3, 6), (6, 3), (4, 6), 6, 5)\}
\end{array}$
}
\caption[Graph representation]{Graph representation.}
\label{fig:graphexample}
\end{figure}
\end{document}
답변2
가장자리 목록에 대한 자동 줄 바꿈을 얻는 것이 가능하지만 적절한 너비를 추측해야 합니다.
subfig문서 클래스 제한(예: )으로 인해 강제로 사용하지 않는 경우 IEEEtran사용하는 것이 더 낫다고 생각하며 너비를 지정할 필요가 없다는 점 과 비슷합니다 subcaption. 모서리 목록의 경우 사용할 수 있습니다.\subcaptionbox\subfloatalignedat
\documentclass{article}

\usepackage{amsmath}
\usepackage{subcaption}
\usepackage{tikz}
\usetikzlibrary{arrows}

\begin{document}

\begin{figure}[htp]
\centering

\subcaptionbox{First figure}{%
  \begin{tikzpicture}[
    >=stealth',
    shorten >=1pt,
    auto,
    node distance=3cm,
    thick,
    main node/.style={circle,draw,font=\sffamily\Large\bfseries}
  ]
  \node[main node] (v1) at (-2,2) {2};
  \node[main node] (v2) at (2,2) {3};
  \node[main node] (v3) at (4,0) {6};
  \node[main node] (v4) at (2,-2) {4};
  \node[main node] (v5) at (-2,-2) {5};
  \node[main node] (v6) at (-4,0) {1};
  \draw  (v1) edge (v2);
  \draw  (v2) edge (v3);
  \draw  (v3) edge (v4);
  \draw  (v4) edge (v5);
  \draw  (v5) edge (v6);
  \draw  (v6) edge (v1);
  \draw  (v5) edge (v1);
  \draw  (v5) edge (v2);
  \draw  (v4) edge (v2);
  \end{tikzpicture}%
}

\medskip

\subcaptionbox{Second figure}{%
  $\!\begin{alignedat}{2}
  V(G) &= \{&& 1, 2, 3, 4, 5, 6\} \\
  E(G) &= \{&& (1, 2), (2, 1), (1, 5), (5, 1), (2, 5), (5, 2),\\
           &&& (2, 3), (3, 2), (5, 3), (3, 5), (5, 4), (4, 5),\\
           &&& (3, 4), (4, 3), (3, 6), (6, 3), (4, 6), 6, 5)\}
  \end{alignedat}$%
}
\caption[Graph representation]{Graph representation.}
\label{fig:graphexample}

\end{figure}

\end{document}

답변3
multlined예를 들어 환경(패키지 mathtools) 또는 aligned패키지 환경 amsmath( mathtools확장)을 사용합니다 .
\documentclass[12pt]{article}

\usepackage{amsmath}
\usepackage{subfig, tikz}

\begin{document}

\begin{figure}[!ht]
   \centering
   \subfloat[First figure]{%
   \begin{tikzpicture}[>=stealth, shorten >=1pt, auto, node distance=3cm,
            thick, main node/.style={circle,draw,font=\sffamily\Large\bfseries}]
      \node[main node] (v1) at (-2,2) {2};
      \node[main node] (v2) at (2,2) {3};
      \node[main node] (v3) at (4,0) {6};
      \node[main node] (v4) at (2,-2) {4};
      \node[main node] (v5) at (-2,-2) {5};
      \node[main node] (v6) at (-4,0) {1};
      \draw  (v1) edge (v2);
      \draw  (v2) edge (v3);
      \draw  (v3) edge (v4);
      \draw  (v4) edge (v5);
      \draw  (v5) edge (v6);
      \draw  (v6) edge (v1);
      \draw  (v5) edge (v1);
      \draw  (v5) edge (v2);
      \draw  (v4) edge (v2);
   \end{tikzpicture}}

   \subfloat[Second figure]{%
   $\begin{aligned}[t]
      V(G) &= \{1, 2, 3, 4, 5, 6\},\\
      E(G) &= \begin{aligned}[t]\{%
         & (1, 2), (2, 1), (1, 5), (5, 1), (2, 5),\\
         & (5, 2), (2, 3),(3, 2), (5, 3), (3, 5),\\
         & (5, 4), (4, 5), (3, 4),  (4, 3),\\
         &  (3, 6),  (6, 3), (4, 6), (6, 5)\}
      \end{aligned}
   \end{aligned}$}

   \caption[Graph representation]{Graph representation.}
   \label{fig:graphexample}
\end{figure}

\end{document}
그런데 코드에 오류가 있거나 >=stealth', 인용문이 잘못된 것 같거나, 다른 인용문이 누락되었습니다(저는 tikz에 대해 잘 모릅니다). 나는 그것을 철회하기로 결정했습니다. 최소한의 작업 예제(MWE)를 제공하는 것이 더 좋았을 것입니다.

답변4
스택을 사용하는 한 가지 방법이 있습니다.
\documentclass{article}
\usepackage{subfig}
\usepackage{tikz}
\usetikzlibrary{arrows}
\usepackage[usestackEOL]{stackengine}
\stackMath
\begin{document}
\begin{figure}[!ht]
\centering
\subfloat[First figure]{
\begin{tikzpicture}[>=stealth', shorten >=1pt, auto, node distance=3cm,
                thick, main node/.style={circle,draw,font=\sffamily\Large\bfseries}]

\node[main node] (v1) at (-2,2) {2};
\node[main node] (v2) at (2,2) {3};
\node[main node] (v3) at (4,0) {6};
\node[main node] (v4) at (2,-2) {4};
\node[main node] (v5) at (-2,-2) {5};
\node[main node] (v6) at (-4,0) {1};
\draw  (v1) edge (v2);
\draw  (v2) edge (v3);
\draw  (v3) edge (v4);
\draw  (v4) edge (v5);
\draw  (v5) edge (v6);
\draw  (v6) edge (v1);
\draw  (v5) edge (v1);
\draw  (v5) edge (v2);
\draw  (v4) edge (v2);
\end{tikzpicture}
}

\subfloat[Second figure]{
\def\stackalignment{l}
\stackunder[8pt]{\kern-.3pt$V(G) = \{1, 2, 3, 4, 5, 6\}$}
{$E(G) = \Longunderstack[r]{\{(1, 2), (2, 1), (1, 5), (5, 1), (2, 5),\\
 (5, 2), (2, 3), (3, 2), (5, 3), (3, 5),\\
 (5, 4), (4, 5), (3, 4), (4, 3), (3, 6),\\
 (6, 3), (4, 6), (6, 5)\}\kern-2.3pt}$
}}
\caption[Graph representation]{Graph representation.}
\label{fig:graphexample}

\end{figure}
\end{document}

\\에서 줄바꿈( )만 이동하면 \Longunderstack다음과 같은 결과를 얻을 수 있습니다.
