


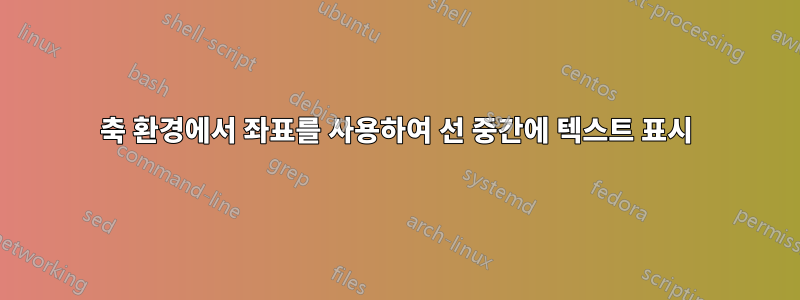
축 환경에서 줄 중간에 텍스트를 표시하고 싶습니다. 최소한의 작업 예는 다음과 같습니다.
\documentclass{article}
\usepackage{currfile}
\usepackage{filecontents}
\usepackage{pgfplots}

\usetikzlibrary{calc}

\begin{filecontents*}{batch_output_5.txt}
    NDOF Nelx Nely hnx hny condKBC errabsu errreleu errrelau beta beta_h
    640     9     9 1.111111111111111e-01 1.111111111111111e-01 1.234567890000000e+00 3.360958503340160e-03 6.801367190507313e-04 6.801883693667268e-04 1.234567890000000e+00 1.234567890000000e+00
    2864    19    19 5.263157894736842e-02 5.263157894736842e-02 1.234567890000000e+00 3.290048281511312e-04 6.939215705384151e-05 6.939186823409962e-05 1.234567890000000e+00 1.234567890000000e+00
    6089    29    29 3.448275862068965e-02 3.448275862068965e-02 1.234567890000000e+00 1.950755726148022e-04 4.494377155875972e-05 4.494363189976460e-05 1.234567890000000e+00 1.234567890000000e+00
    10450    39    39 2.564102564102564e-02 2.564102564102564e-02 1.234567890000000e+00 1.818287989540975e-04 3.111970271342298e-05 3.111966516370642e-05 1.234567890000000e+00 1.234567890000000e+00
   \end{filecontents*}

\begin{document}
    \begin{tikzpicture}
        \begin{loglogaxis}
        [
            unit vector ratio=1 1 1,
            %unit vector ratio*=1 1 1,
            ymin=10^-5,
            ymax=10^-2,
        ]
            \addplot table[x index=3,y index=7] {\currfiledir batch_output_5.txt};

            % Triangle coordinates.
            \pgfplotstablegetelem{0}{[index]3}\of{\currfiledir batch_output_5.txt}
            \edef\triangleAcoordAx{\pgfplotsretval}
            \pgfplotstablegetelem{0}{[index]7}\of{\currfiledir batch_output_5.txt}
            \edef\triangleAcoordAy{\pgfplotsretval}
            \pgfplotstablegetelem{1}{[index]3}\of{\currfiledir batch_output_5.txt}
            \edef\triangleAcoordBx{\pgfplotsretval}
            \pgfplotstablegetelem{1}{[index]7}\of{\currfiledir batch_output_5.txt}
            \edef\triangleAcoordBy{\pgfplotsretval}
            \pgfplotstablegetelem{0}{[index]3}\of{\currfiledir batch_output_5.txt}
            \edef\triangleAcoordCx{\pgfplotsretval}
            \pgfplotstablegetelem{1}{[index]7}\of{\currfiledir batch_output_5.txt}
            \edef\triangleAcoordCy{\pgfplotsretval}

            \coordinate (offset) at (0.2,-0.2);
            \coordinate (triangleAcoordA) at (axis cs:\triangleAcoordAx,\triangleAcoordAy);
            \coordinate (triangleAcoordB) at (axis cs:\triangleAcoordBx,\triangleAcoordBy);
            \coordinate (triangleAcoordC) at (axis cs:\triangleAcoordCx,\triangleAcoordCy);

            \coordinate (shiftedTriangleAcoordA) at ($(triangleAcoordA)+(offset)$);
            \coordinate (shiftedTriangleAcoordB) at ($(triangleAcoordB)+(offset)$);
            \coordinate (shiftedTriangleAcoordC) at ($(triangleAcoordC)+(offset)$);

            % Draw triangle.
            \draw[black]    (shiftedTriangleAcoordA)--
                            (shiftedTriangleAcoordB)--
                            (shiftedTriangleAcoordC)--
                            cycle;
            \draw ($(shiftedTriangleAcoordB)+(shiftedTriangleAcoordC)-(shiftedTriangleAcoordB)$) node[anchor=north]{1};
            \draw ($(shiftedTriangleAcoordC)+(shiftedTriangleAcoordA)-(shiftedTriangleAcoordC)$) node[anchor=west]{2};
        \end{loglogaxis}
    \end{tikzpicture}
\end{document}
따라서 마지막 두 \draw명령은 다음과 같아야 합니다.
\draw ($(shiftedTriangleAcoordB)+((shiftedTriangleAcoordC)-(shiftedTriangleAcoordB))/2$) node[anchor=north]{1};
, 그러나 해당 명령은 허용되지 않습니다. 이 문제를 어떻게 해결하나요?
보조 질문:
1) 나중에 좌표에 사용하기 위해 테이블의 데이터를 LaTeX 변수에 저장하는 더 우아한 방법이 있습니까? 모든 것이 너무 번거로워 보입니다.
2) 0.2,-0.2좌표에서 사용된 는 offset어디를 가리키는가? axis cs그래프의 너비와 높이의 백분율에 해당하지 않는다고 생각합니까 ?
답변1
진행 중인 솔루션
정말 많은 방법이 있습니다. 당신은 할 수
\draw ($(shiftedTriangleAcoordC)!0.5!(shiftedTriangleAcoordA)$) node[anchor=west]{2};
shiftedTriangleAcoordC"에서 " 까지 의 경로를 따라 중간"으로 이동 shiftedTriangleAcoordA하거나 다음과 같이 경로 그리기에서 직접 노드를 사용합니다(반복 감소).
% Draw triangle.
\draw[black] (shiftedTriangleAcoordA)-- node[left,pos=0.5] {halfway}
             (shiftedTriangleAcoordB)--
             (shiftedTriangleAcoordC)-- node[right,pos=0.5] {halfway also}
             cycle;
또는 댓글의 솔루션을 사용하세요.
공사중 구역 진입
하지만 처음에 좌표를 정의하는 더 좋은 방법에 대해서도 문의하셨습니다. 이 pos=<fraction>구문은 명령에서도 사용할 수 있습니다 \addplot.
계속하려면 ...
답변2
텍스트를 줄 중간에 가져오려면 다음 명령을 사용하십시오.
\coordinate (midBC) at ($(shiftedTriangleAcoordB)+0.5*(shiftedTriangleAcoordC)-0.5*(shiftedTriangleAcoordB)$);
\coordinate (midAC) at ($(shiftedTriangleAcoordC)+0.5*(shiftedTriangleAcoordA)-0.5*(shiftedTriangleAcoordC)$);

\draw (midBC) node[anchor=north]{1};
\draw (midAC) node[anchor=west]{2};
MaartenDhondt에게 감사드립니다.