


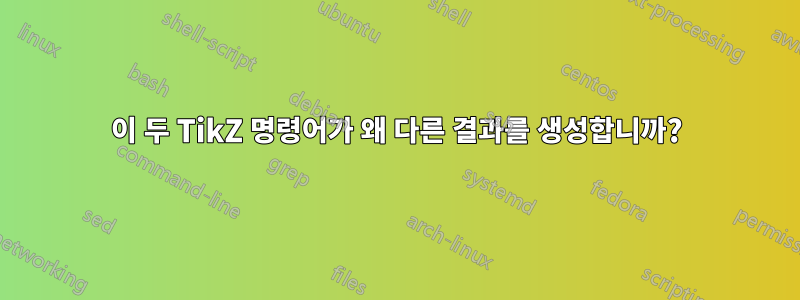
나는 광학에 관한 강의를 위한 그림을 그리기 위해 교차점을 가지고 놀고 있습니다. 그러나 다음 예제에서 볼 수 있듯이 몇 가지 문제가 있습니다.
%!TEX encoding = UTF-8 Unicode
%!TEX program = lualatex
\documentclass[11pt,a4paper,fleqn,pdftex]{report}
\usepackage[dvipsnames, table]{xcolor}
\usepackage[utf8]{luainputenc}
\usepackage[latin,english]{babel}
\usepackage{tikz}
\usetikzlibrary{patterns}
\usetikzlibrary{shapes.geometric}

\begin{document}
    \begin{figure}[!h]
   \centering
   \begin{tikzpicture}
      \coordinate (M2) at (0,3);
      \def\angleM{10}
% >>>>>>>>>>>>>>>>
      \draw[color=Red, thick] (M2) --  (intersection cs: first line={(M2)--++(90 - \angleM:-8)}, second line={(45:-4)--(45:4)}) circle (2pt);
      \draw[color=Red, thick] (intersection cs: first line={(M2)--++(90 - \angleM:-8)}, second line={(45:-4)--(45:4)}) circle (2pt) -- (M2);
% <<<<<<<<<<<<<<<<
      \draw[thick] (M2) ++(1,0) -- ++(-2,0) node[left]{$M_2$};
      \fill[pattern=north east lines] (M2) ++(1,0) rectangle ++(-2,0.2);
      \draw[very thick] (45:-2) -- (45:2);
   \end{tikzpicture}
\end{figure}
\end{document}
% >>>>>…이 예에서 와 사이의 두 선은 % <<<<…동일한 선을 그려야 하지만 여기서 볼 수 있는 것처럼 그렇지 않습니다.

지침은 거의 동일하지만(그리는 방향만 다름) 선이 겹치지 않습니다. 이를 방지하려면 어떻게 해야 합니까?
답변1
이것은 반올림 문제인 것 같습니다. 이 문제와 에서 논의된 문제TikZ가 교차점을 계산하지 않음교차 좌표계에 몇 가지 문제가 있음을 시사합니다(사실 PGF 매뉴얼에서는 이에 대해 언급하지 않고 사용 예만 제시합니다).
어쨌든 해결 방법으로 intersections라이브러리를 로드한 다음 다음을 수행 할 수 있습니다.
\path
  [name path=line1] (M2) -- ++(90 - \angleM:-8)
  [name path=line2] (45:-4) -- (45:4);
\draw[Red,thick,name intersections={of=line1 and line2}]
  (intersection-1) circle (2pt) -- (M2);
이는 를 사용하는 것보다 약간 길지만 intersection cs반올림 문제로 인해 결과가 달라도 문제가 되지 않습니다. 두 가지 접근 방식을 나란히 보여주는 전체 예:
%!TEX encoding = UTF-8 Unicode
%!TEX program = lualatex
\documentclass[11pt,a4paper,fleqn,pdftex]{report}
\usepackage[dvipsnames, table]{xcolor}
\usepackage[utf8]{luainputenc}
\usepackage[latin,english]{babel}
\usepackage{tikz}
\usetikzlibrary{patterns}
\usetikzlibrary{shapes.geometric}
\usetikzlibrary{intersections}

\begin{document}

   \begin{tikzpicture}[baseline]
      \coordinate (M2) at (0,3);
      \def\angleM{10}
% >>>>>>>>>>>>>>>>
      \draw[color=Red, thick] (M2) --  (intersection cs: first line={(M2)--++(90 - \angleM:-8)}, second line={(45:-4)--(45:4)}) circle (2pt);
      \draw[color=Red, thick] (intersection cs: first line={(M2)--++(90 - \angleM:-8)}, second line={(45:-4)--(45:4)}) circle (2pt) -- (M2);
% <<<<<<<<<<<<<<<<
      \draw[thick] (M2) ++(1,0) -- ++(-2,0) node[left]{$M_2$};
      \fill[pattern=north east lines] (M2) ++(1,0) rectangle ++(-2,0.2);
      \draw[very thick] (45:-2) -- (45:2);
   \end{tikzpicture}\qquad
%
   \begin{tikzpicture}[baseline]
      \coordinate (M2) at (0,3);
      \def\angleM{10}

      \path
        [name path=line1] (M2) -- ++(90 - \angleM:-8)
        [name path=line2] (45:-4) -- (45:4);
      \draw[Red,thick,name intersections={of=line1 and line2}]
        (intersection-1) circle (2pt) -- (M2);

      \draw[thick] (M2) ++(1,0) -- ++(-2,0) node[left]{$M_2$};
      \fill[pattern=north east lines] (M2) ++(1,0) rectangle ++(-2,0.2);
      \draw[very thick] (45:-2) -- (45:2);
   \end{tikzpicture}

\end{document}
