


나는 다음을 가지고 있습니다 :
\documentclass{article}
\usepackage{pgfplots}
\usepackage{mathtools}
\usepgfplotslibrary{fillbetween}
\usetikzlibrary{patterns}

\begin{document}

\begin{tikzpicture}
\begin{axis}[
    axis lines = middle,
    xlabel = $x$,
    ylabel = {$\begin{aligned}
        \color{blue} f(x)& \color{blue}=1\\
        \color {red} g(x)& \color{red}=|x|
    \end{aligned}$}
]

\addplot [
    name path = A,
    domain=-2:2,
    color=blue,
]
{1};

\addplot [
    name path = B,
    domain=-2:2,
    color=red,
]
{abs(x))};

\addplot [
    pattern=north west lines,
]
fill between [
    of=A and B,
    soft clip={domain=-1:1}
];

\end{axis}
\end{tikzpicture}

\end{document}
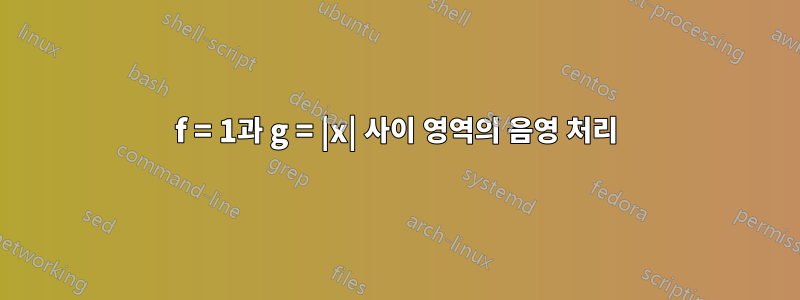
나는 그 사이에 제한된 영역에 그늘을 드리우는 것을 목표로 합니다.
f(x) = 1
그리고
g(x) = |x|
그러나 대신 나타나는 것은 다음과 같습니다.

그래프는 그려지지만 영역이 음영 처리되지 않습니다. 두 기능을 대체 기능으로 전환해 보았지만 제대로 작동하므로 여기서 문제가 무엇인지 잘 모르겠습니다. (저는 ShareLaTex를 사용하고 있습니다)
답변1
(기록을 위해: PGFPlots v1.16이 출시되면서 귀하의 예는 예상된 결과를 제공합니다. 그러나 원하는 것을 달성하는 더 좋고/쉬운 방법이 있습니다.)
domainuse를 사용하는 대신 split개별적으로 처리할 수 있는 3개의 세그먼트를 제공합니다. 따라서 아무것도 채우지 않는 일반 옵션( fill=none)을 제공한 다음 " segment no 1" 스타일에 원하는 채우기 패턴을 지정하십시오. (세그먼트는 0부터 계산되기 시작하므로 여기서는 1번이 필요하거나 원하는 세그먼트입니다.)
% used PGFPlots v.1.14
\documentclass[border=5pt]{standalone}
\usepackage{pgfplots}
\usepackage{amsmath}
    \usetikzlibrary{
        patterns,
        pgfplots.fillbetween,
    }
\begin{document}
    \begin{tikzpicture}
        \begin{axis}[
            axis lines=middle,
            xlabel=$x$,
            ylabel={
                $\begin{aligned}
                    \color{blue} f(x)& \color{blue}=1\\
                    \color {red} g(x)& \color{red}=|x|
                \end{aligned}$
            },
        ]
            \addplot [
                name path=A,
                domain=-2:2,
                color=blue,
            ] {1};

            \addplot [
                name path = B,
                domain=-2:2,
                color=red,
            ] {abs(x)};

            \addplot [
                fill=none,
            ] fill between [
                of=A and B,
                % --------------------------------------
                % the below code is what I have changed
                split,
                % draw only selected ones:
                % every segment no 0/.style: invisible
                every segment no 1/.style={
                    pattern=north west lines,
                },
                % every segment no 2/.style: invisible
            ];

        \end{axis}
    \end{tikzpicture}
\end{document}

답변2
fillbetween나는 이것이 라이브러리의 버그(또는 적어도 예상치 못한 동작)라고 생각합니다 pgfplots. 참고로 이는 사용자로서의 개인적인 견해일 뿐이며 그렇게 동작하는 데에는 특별한 이유가 있을 수도 있습니다.
이 동작을 재현하는 데 필요하지 않은 모든 부분을 제거한 아래 예를 고려하십시오. 귀하의 예에서와 같이 영역이 채워지지 않습니다. 그러나 해당 줄을 주석 처리만 하면 axis lines=middle해당 영역이 예상대로 채워집니다.
\documentclass{article}
\usepackage{pgfplots}
\usepgfplotslibrary{fillbetween}

\begin{document}
\begin{tikzpicture}
\begin{axis}[
    axis lines=middle,
    domain=-2:2,
]

\addplot[name path=A,color=blue]{1};
\addplot[name path=B,color=red]{abs(x))};
\addplot[black] fill between[of=A and B,soft clip={domain=-1:1}];

\end{axis}
\end{tikzpicture}
\end{document}


0활성화 했을 때 포인트 처리에 문제가 있는 것 같습니다 axis lines=middle. 간단한 해결 방법은 fill between에서 하나를 사용 -1:0하고 에서 별도의 하나를 사용하는 것입니다 0:1. 또는 splitStefan Pinnow가 제안한 방법을 사용하십시오.
\addplot[pattern=north west lines] fill between[of=A and B,soft clip={domain=-1:0}];
\addplot[pattern=north west lines] fill between[of=A and B,soft clip={domain=0:1}];
