


다음 mwe는 pgfgantt 패키지를 약간 오용한 것입니다. 더 큰 작업을 구성하는 다양한 하위 작업의 상대적인 노력과 각 하위 작업의 완료 상태 등을 표시해야 합니다. 개별 하위 작업의 타이밍을 무시하고 주 작업의 전체 완료 상태에 대한 감각을 제공해야 합니다. .
개별 하위 작업의 진행 상황을 거의 소용이 없도록 표시하는 레이블 위치를 개선하는 데 시간을 보냈습니다.
진행률 레이블을 중앙 아래 또는 위에 배치하는 방법에 대한 제안전체하위 작업(완전/불완전 경계에 있지 않음)을 환영합니다.
\NeedsTeXFormat{LaTeX2e}
\documentclass[12pt]{standalone}
\usepackage{pgfgantt}
\usepackage{times}

\definecolor{teal}{rgb}{0,0.57,0.81}%
\definecolor{aqua}{rgb}{0.51,0.81,0.79}%
\definecolor{blue_gray}{rgb}{0.36,0.52,0.63}%

% create a new command for a ganttbar entry
\newcommand{\ganttbarentryprogresscustom}[5]{%
\ganttbar[progress=#1,%
bar/.append style={pattern color = #2},%
bar progress label anchor=south,%
bar inline label node/.style={above=3pt}]%
{#3}{#4}{#5}%
}%

\begin{document}
\begin{ganttchart}[%
x unit=1.4cm,%
y unit chart=1.1cm,%
time slot unit=day,%
bar/.append style={pattern=north west lines, pattern color = cyan},%
inline%
]{0}{11}%
\ganttgroup[inline=false]{Task 1}{1}{10}\\%
\ganttbarentryprogresscustom{100}{blue_gray}{Subtask 1}{1}{6}
\ganttbarentryprogresscustom{90}{teal}{Subtask 2}{7}{8}%
\ganttbarentryprogresscustom{75}{aqua}{Subtask 3}{9}{10}%
\end{ganttchart}
\end{document}
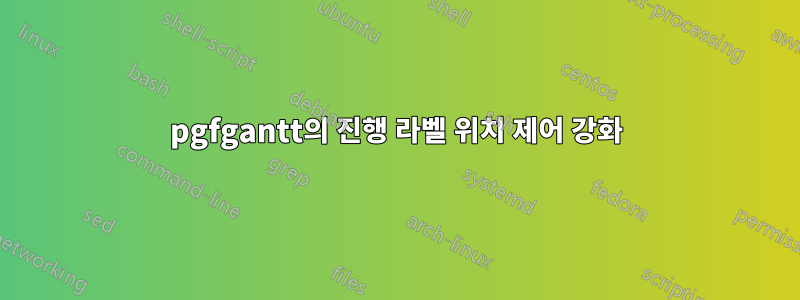
출력은 다음과 같습니다.

답변1
을 추가하면 bar progress label node/.append style={anchor=north,yshift=0.2em},,
\NeedsTeXFormat{LaTeX2e}
\documentclass[12pt]{standalone}
\usepackage{pgfgantt}
\usepackage{times}

\definecolor{teal}{rgb}{0,0.57,0.81}%
\definecolor{aqua}{rgb}{0.51,0.81,0.79}%
\definecolor{blue_gray}{rgb}{0.36,0.52,0.63}%

% create a new command for a ganttbar entry
\newcommand{\ganttbarentryprogresscustom}[5]{%
\ganttbar[progress=#1,%
bar/.append style={pattern color = #2},%
bar progress label anchor=south,%
bar progress label node/.append style={anchor=north,yshift=0.2em},
bar inline label node/.style={above=3pt}]%
{#3}{#4}{#5}%
}%

\begin{document}
\begin{ganttchart}[%
x unit=1.4cm,%
y unit chart=1.1cm,%
time slot unit=day,%
bar/.append style={pattern=north west lines, pattern color = cyan},%
inline%
]{0}{11}%
\ganttgroup[inline=false]{Task 1}{1}{10}\\%
\ganttbarentryprogresscustom{100}{blue_gray}{Subtask 1}{1}{6}
\ganttbarentryprogresscustom{90}{teal}{Subtask 2}{7}{8}%
\ganttbarentryprogresscustom{75}{aqua}{Subtask 3}{9}{10}%
\end{ganttchart}
\end{document}
