


나는 Tikz 사진에 그린 푸른 강 외부에 검은색 테두리를 원하지만 문제는 테두리가 강 내부와 교차하는 직사각형 구성 요소로 이것을 그렸기 때문입니다. 이 문제를 어떻게 해결합니까?
\begin{minipage}{\textwidth}
\begin{figure}[H]
\centering
\begin{tikzpicture}
\definecolor{customgreen}{HTML}{a1fb7f}
\definecolor{customblue}{HTML}{7b87ea}
% Draw the green land with a sharp border
\draw[fill=customgreen, draw=black, line width=0.5pt] (-7, -6) rectangle (7, 3);
% Then draw the blue rivers with a sharp blue border
% Extend bottom stream to the left
\draw[fill=customblue, draw=black] (-3, -2+.125) -- (-7,-2+.125) -- (-7,-1.125) -- (-3,-1.125) -- cycle;
% Extend the top stream to the right
\draw[fill=customblue, draw=black] (-3, 2) -- (7, 2) --(7, 2-.75) --(-3, 2-.75) -- cycle;
% Other parts of the river
\draw[fill=customblue, draw=black] (-3, 2) -- (-3+.75, 2) -- (-3+.75,-2+.125) -- (-3,-2+.125) -- cycle;
\draw[fill=customblue, draw=black] (3, 2-.75) -- (3-.75, 2-.75) --(3-.75, -5) --(3, -5) -- cycle;
\draw[fill=customblue, draw=black] (-3+.75, -1.125) -- (3-.75, -1.125) --(3-.75, -1.125-.75) --(-3+.75, -1.125-.75) -- cycle;
\draw[fill=customblue, draw=black] (3-.75, -5) -- (7, -5) --(7, -5+.75) --(3-.75, -5+.75) -- cycle;
% Nodes at landmasses
\node at (0, 0) {A};
\node at (5, -1.5) {B};
\node at (2.62500, 2.5) {C};
\node at (2.62500, -5.5) {D};
% Bridges with black borders
\filldraw[fill=brown, draw=black, line width=0.5pt] (-1.65, -1.125+.6) rectangle (-1.15, -1.875-.6); % Bridge 1
\filldraw[fill=brown, draw=black, line width=0.5pt] (-.25, -1.125+.6) rectangle (0.25, -1.875-.6); % Bridge 2
\filldraw[fill=brown, draw=black, line width=0.5pt] (-1.65, 2+.6) rectangle (-1.15, 1.25-.6); % Bridge 3
\filldraw[fill=brown, draw=black, line width=0.5pt] (-.25, 2+.6) rectangle (0.25, 1.25-.6); % Bridge 4
\filldraw[fill=brown, draw=black, line width=0.5pt] (2.25-.6, .25) rectangle (3+.6, -.25); % Bridge 5
\filldraw[fill=brown, draw=black, line width=0.5pt] (5-.25, 2+.6) rectangle (5.25, 1.25-.6); % Bridge 7
\filldraw[fill=brown, draw=black, line width=0.5pt] (5-.25, -5+.75+.6) rectangle (5.25, -5-.6); % Bridge 8
\end{tikzpicture}
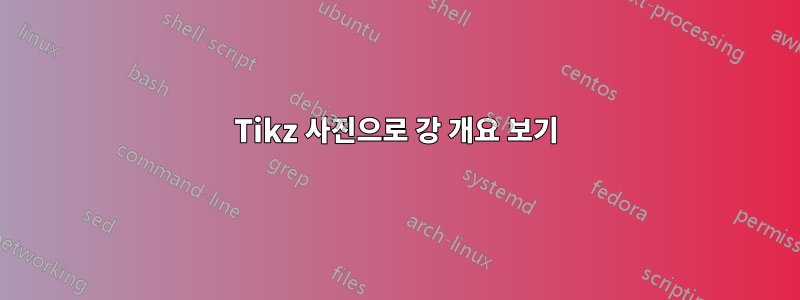
\caption{Map of Königsberg. The blue represents the Pregel River while
the green represents land. There are seven brown rectangles
representing bridges connecting land masses.} \label{fig:figure1}
\end{figure}
\end{minipage}
산출:

답변1
옵션 을 사용하여 이를 수행할 수 있습니다 double. 단일 \draw명령을 사용하십시오. 교량에 대해서도 동일한 작업을 수행할 수 있습니다. 를 사용하면 line cap=butt색상 주위에 완전한 테두리가 그려지지만 line cap=rect끝 부분은 포함되지 않습니다. 그러나 엉덩이 캡은 좌표를 넘어 확장됩니다.

\documentclass{article}

\usepackage{tikz}
\definecolor{customgreen}{HTML}{a1fb7f}
\definecolor{customblue}{HTML}{7b87ea}

\begin{document}

\begin{tikzpicture}
\draw[thick, fill=customgreen](0,-4)rectangle(11,4);
\draw[line cap=butt, thick, double=customblue, double distance=6mm]
    (0,0)--(7,0)
    (3,0)--(3,3)--(11,3)
    (7,3)--(7,-3)--(11,-3);
\draw[line cap=rect, thick, double=brown, double distance=4mm]
    (4,-.5)--(4,.5)
    (6,-.5)--(6,.5)
    (4,2.5)--(4,3.5)
    (6,2.5)--(6,3.5)
    (9,2.5)--(9,3.5)
    (9,-2.5)--(9,-3.5)
    (6.5,1.5)--(7.5,1.5);
\end{tikzpicture}