


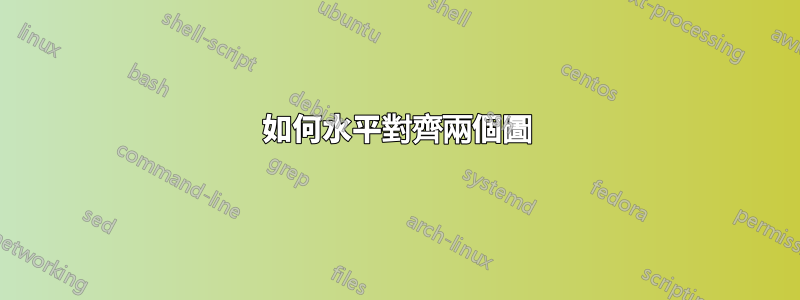
我想水平對齊這兩個圖:
 \begin{tikzpicture}
        \begin{axis}[
            xmin=1995,
            xmax=2010,
            ymode=log,
            xtick={1975,1980,...,2015},
            x tick label style={/pgf/number format/1000 sep=},
            xlabel={Year},
            ylabel={Cost of gene synthesis $(\$/base$)},
        ]
            \addplot coordinates {(1998,30) (2001,15) (2002,10) (2003,5) (2006,0) (2007,0.7)};
        \end{axis}
    \end{tikzpicture}
和
\begin{tikzpicture}
        \begin{axis}[
            xmin=1975,
            xmax=2010,
            ymode=log,
            xtick={1975,1980,...,2015},
            x tick label style={/pgf/number format/1000 sep=},
            xlabel={Year},
            ylabel={Length in base pairs},
        ]
            \addplot coordinates {(1978,207) (1990,2100) (1995,2700) (2003,7500) (2005,14600) (2006,32000) (2009,583000)};
        \end{axis}
    \end{tikzpicture}
我嘗試使用\subfigure但沒有成功。
答案1
這是我的做法,使用subcaption包裝如您所願

我冒昧地將您的ylabel文字移至標題中。我width=\textwidth也設定了
您可能想探索scale only axis它非常有用 - 我已將其留在序言中作為註釋供您使用。
% arara: pdflatex
% !arara: indent: {overwrite: true}
\documentclass{article}

\usepackage{pgfplots}
\usepackage{subcaption}

%\pgfplotsset{every axis/.append style={
%                    scale only axis,       % otherwise width won't be as intended: http://tex.stackexchange.com/questions/36297/pgfplots-how-can-i-scale-to-text-width
%                    }}

\begin{document}

\begin{figure}[!ht]
    \begin{subfigure}[t]{.5\textwidth}
        \begin{tikzpicture}
            \begin{axis}[
                    xmin=1995,
                    xmax=2010,
                    ymode=log,
                    xtick={1975,1980,...,2015},
                    x tick label style={/pgf/number format/1000 sep=},
                    xlabel={Year},
                    width=\textwidth,
                ]
                \addplot coordinates {(1998,30) (2001,15) (2002,10) (2003,5) (2006,0) (2007,0.7)};
            \end{axis}
        \end{tikzpicture}
        \caption{Cost of gene synthesis ($\$/base$)},
    \end{subfigure}%
    \begin{subfigure}[t]{.5\textwidth}
        \begin{tikzpicture}
            \begin{axis}[
                    xmin=1975,
                    xmax=2010,
                    ymode=log,
                    xtick={1975,1985,...,2015},
                    x tick label style={/pgf/number format/1000 sep=},
                    xlabel={Year},
                    width=\textwidth,
                ]
                \addplot coordinates {(1978,207) (1990,2100) (1995,2700) (2003,7500) (2005,14600) (2006,32000) (2009,583000)};
            \end{axis}
        \end{tikzpicture}
        \caption{Length in base pairs}
    \end{subfigure}%
\end{figure}
\end{document}
答案2
我通常只是將它們放在一個center環境中:
\begin{center}
 \begin{tikzpicture} \begin{axis} ... \end{axis} \end{tikzpicture}
 \hfil
 \begin{tikzpicture} \begin{axis} ... \end{axis} \end{tikzpicture}
\end{center}
還有與其\usepgfplots{groupplots}相關的矩陣式排列,記錄在pgfplots手冊第 5.5 節。