


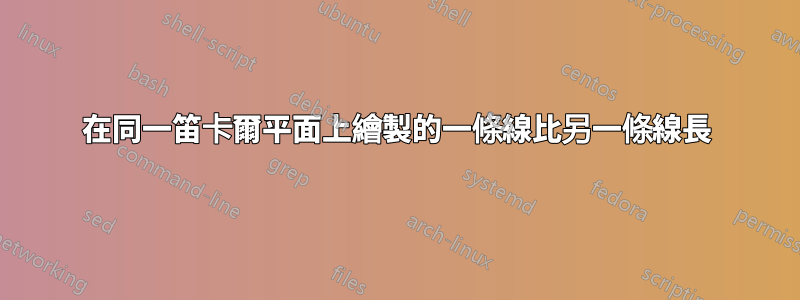
為什麼兩條線的長度不同?斜線應該縮短一點 - 也許縮短 2ex - 並且垂直線應該加長以獲得與斜線相同的高度。
如何得到另一側斜線的方程式?它現在所在的位置看起來像是我正在標記曲線 y=(3/2)x + 5/2。
如果我想在 x 軸上方繪製更多的圖形,我應該在程式碼中更改什麼? ymax=25代替ymax=15?
\documentclass{amsart}
\usepackage{tikz}
\usepackage{pgfplots}
\pgfplotsset{compat=1.11}


\begin{document}


\begin{tikzpicture}
\begin{axis}[width=4in,axis equal image,clip=false,
    axis lines=middle,
    xmin=-15,xmax=15,
    domain=-15:15, samples=101,
    xlabel=$x$,ylabel=$y$,
    ymin=-15,ymax=15,
    restrict y to domain=-20:20,
    enlargelimits={abs=1cm},
    axis line style={latex-latex},
    ticklabel style={font=\tiny,fill=white},
    xtick={\empty},ytick={\empty}
]
\addplot[samples=251,domain=-25:1.5] {(3*x^2+5*x)/(2*x-3)};
\addplot[samples=251,domain=1.5:25] {(3*x^2+5*x)/(2*x-3)} node[above,pos=0.85]{$\scriptstyle{y}=\frac{3x^{2}+5x}{2x-3}$};
\addplot [dashed, latex-latex] {(3/2)*x+5/2} node [pos=0.15, anchor=south, font=\footnotesize, sloped] {$y=\frac{3}{2}x+\frac{5}{2}$};
\addplot [dashed, latex-latex] (1.5,x) node [pos=0.15, anchor=north, font=\footnotesize, sloped] {$x=\frac{3}{2}$};
\end{axis}
\end{tikzpicture}

\end{document}

答案1
\documentclass{amsart}
\usepackage{tikz}
\usepackage{pgfplots}
\pgfplotsset{compat=1.11}


\begin{document}


\begin{tikzpicture}
\begin{axis}[width=4in,axis equal image,clip=false,
    axis lines=middle,
    xmin=-15,xmax=15,
    samples=101,
    xlabel=$x$,ylabel=$y$,
    ymin=-15,ymax=15,
    restrict y to domain=-20:25,
    enlargelimits={abs=1cm},
    axis line style={latex-latex},
    ticklabel style={font=\tiny,fill=white},
    xtick={\empty},ytick={\empty},
]
\addplot[samples=251,domain=-25:1.5] {(3*x^2+5*x)/(2*x-3)};
\addplot[samples=251,domain=1.5:15] {(3*x^2+5*x)/(2*x-3)} node[above right,anchor=south west,pos=0.95]{$\scriptstyle{y}=\frac{3x^{2}+5x}{2x-3}$};
\addplot [dashed, latex-latex,domain=-13:10] {(3/2)*x+5/2} node [pos=0.15, anchor=north, font=\footnotesize, sloped] {$y=\frac{3}{2}x+\frac{5}{2}$};
\addplot [dashed, latex-latex,domain=-17:17.5] (1.5,x) node [pos=0.15, anchor=north, font=\footnotesize, sloped] {$x=\frac{3}{2}$};
\end{axis}
\end{tikzpicture}

\end{document}

一些解釋:
您可以將適當的網域新增到虛線圖中。對於斜線,我們假設我們修復了,domain=-13:10。則 的最大值和最小值分別y為17.5和-17。不,我們將這些值固定y在垂直虛線中,如domain=-17:17.5座標 中{1.5,x}。
若要將斜線的標籤置於下方,請將錨點變更為anchor=north,。
若要延長上面的曲線,您必須變更 中的值restrict y to domain=-20:25,。相應地改變 、、ymax和值,以獲得適當的軸線長度。 (或更改in的值)。xmaxyminxminabs=1cmenlargelimits