


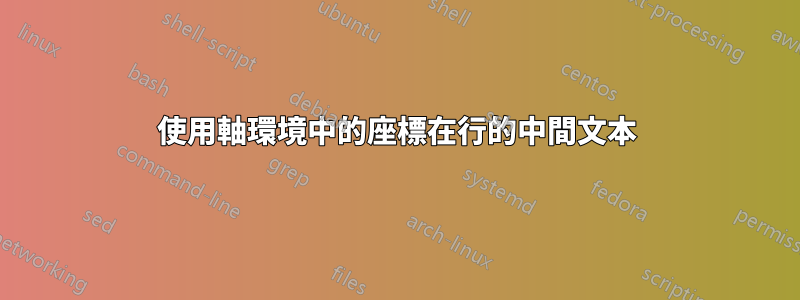
我想在軸環境中表示行的中間文字。這是一個最小的工作範例:
\documentclass{article}
\usepackage{currfile}
\usepackage{filecontents}
\usepackage{pgfplots}

\usetikzlibrary{calc}

\begin{filecontents*}{batch_output_5.txt}
    NDOF Nelx Nely hnx hny condKBC errabsu errreleu errrelau beta beta_h
    640     9     9 1.111111111111111e-01 1.111111111111111e-01 1.234567890000000e+00 3.360958503340160e-03 6.801367190507313e-04 6.801883693667268e-04 1.234567890000000e+00 1.234567890000000e+00
    2864    19    19 5.263157894736842e-02 5.263157894736842e-02 1.234567890000000e+00 3.290048281511312e-04 6.939215705384151e-05 6.939186823409962e-05 1.234567890000000e+00 1.234567890000000e+00
    6089    29    29 3.448275862068965e-02 3.448275862068965e-02 1.234567890000000e+00 1.950755726148022e-04 4.494377155875972e-05 4.494363189976460e-05 1.234567890000000e+00 1.234567890000000e+00
    10450    39    39 2.564102564102564e-02 2.564102564102564e-02 1.234567890000000e+00 1.818287989540975e-04 3.111970271342298e-05 3.111966516370642e-05 1.234567890000000e+00 1.234567890000000e+00
   \end{filecontents*}

\begin{document}
    \begin{tikzpicture}
        \begin{loglogaxis}
        [
            unit vector ratio=1 1 1,
            %unit vector ratio*=1 1 1,
            ymin=10^-5,
            ymax=10^-2,
        ]
            \addplot table[x index=3,y index=7] {\currfiledir batch_output_5.txt};

            % Triangle coordinates.
            \pgfplotstablegetelem{0}{[index]3}\of{\currfiledir batch_output_5.txt}
            \edef\triangleAcoordAx{\pgfplotsretval}
            \pgfplotstablegetelem{0}{[index]7}\of{\currfiledir batch_output_5.txt}
            \edef\triangleAcoordAy{\pgfplotsretval}
            \pgfplotstablegetelem{1}{[index]3}\of{\currfiledir batch_output_5.txt}
            \edef\triangleAcoordBx{\pgfplotsretval}
            \pgfplotstablegetelem{1}{[index]7}\of{\currfiledir batch_output_5.txt}
            \edef\triangleAcoordBy{\pgfplotsretval}
            \pgfplotstablegetelem{0}{[index]3}\of{\currfiledir batch_output_5.txt}
            \edef\triangleAcoordCx{\pgfplotsretval}
            \pgfplotstablegetelem{1}{[index]7}\of{\currfiledir batch_output_5.txt}
            \edef\triangleAcoordCy{\pgfplotsretval}

            \coordinate (offset) at (0.2,-0.2);
            \coordinate (triangleAcoordA) at (axis cs:\triangleAcoordAx,\triangleAcoordAy);
            \coordinate (triangleAcoordB) at (axis cs:\triangleAcoordBx,\triangleAcoordBy);
            \coordinate (triangleAcoordC) at (axis cs:\triangleAcoordCx,\triangleAcoordCy);

            \coordinate (shiftedTriangleAcoordA) at ($(triangleAcoordA)+(offset)$);
            \coordinate (shiftedTriangleAcoordB) at ($(triangleAcoordB)+(offset)$);
            \coordinate (shiftedTriangleAcoordC) at ($(triangleAcoordC)+(offset)$);

            % Draw triangle.
            \draw[black]    (shiftedTriangleAcoordA)--
                            (shiftedTriangleAcoordB)--
                            (shiftedTriangleAcoordC)--
                            cycle;
            \draw ($(shiftedTriangleAcoordB)+(shiftedTriangleAcoordC)-(shiftedTriangleAcoordB)$) node[anchor=north]{1};
            \draw ($(shiftedTriangleAcoordC)+(shiftedTriangleAcoordA)-(shiftedTriangleAcoordC)$) node[anchor=west]{2};
        \end{loglogaxis}
    \end{tikzpicture}
\end{document}
所以最後兩個\draw指令應該是這樣的
\draw ($(shiftedTriangleAcoordB)+((shiftedTriangleAcoordC)-(shiftedTriangleAcoordB))/2$) node[anchor=north]{1};
,但該命令不被接受。我該如何解決這個問題?
次要問題:
1)是否有更優雅的方法將表中的資料保存在 LaTeX 變數中,以便稍後在座標中使用它們?一切看起來都是那麼的麻煩。
2)0.2,-0.2座標中的asoffset指的是哪裡?我不認為它是axis cs圖表寬度和高度的百分比?
答案1
正在進行的解決方案
確實有很多方法。你可以做
\draw ($(shiftedTriangleAcoordC)!0.5!(shiftedTriangleAcoordA)$) node[anchor=west]{2};
獲得“從shiftedTriangleAcoordC到 的路徑的中途shiftedTriangleAcoordA”,或直接在路徑繪圖中使用節點(減少重複),例如:
% Draw triangle.
\draw[black] (shiftedTriangleAcoordA)-- node[left,pos=0.5] {halfway}
             (shiftedTriangleAcoordB)--
             (shiftedTriangleAcoordC)-- node[right,pos=0.5] {halfway also}
             cycle;
或使用評論中的解決方案。
進入施工區
但您也詢問了一種更好的方法來先定義座標。該語法也pos=<fraction>可以在指令中使用。\addplot
待續...
答案2
要獲取行中的文本,請使用以下命令
\coordinate (midBC) at ($(shiftedTriangleAcoordB)+0.5*(shiftedTriangleAcoordC)-0.5*(shiftedTriangleAcoordB)$);
\coordinate (midAC) at ($(shiftedTriangleAcoordC)+0.5*(shiftedTriangleAcoordA)-0.5*(shiftedTriangleAcoordC)$);

\draw (midBC) node[anchor=north]{1};
\draw (midAC) node[anchor=west]{2};
感謝 MaartenDhondt。