


我正在繪製一個指數函數,我需要在圖中指出一些特定值。
點名稱 (x;y)
點 N1 (2;50)
點 N2 (4;25)
我正在努力追隨貢薩洛·梅迪納的回答但我沒有任何成功
\begin{figure}[H]
\begin{tikzpicture}[scale=1.5]
\begin{axis}[
    domain=10:1,
    axis lines=left,
    grid=both,
    clip=false,
    xlabel=$Tempo (dias)$,
    ylabel=$Atividade (Ci)$
]
\addplot[name path=curve,smooth,thick,black]{100*exp(-x*ln(2)/2)};
\addplot[name path=line,smooth,dashed,red]{50};
\path[name intersections={of=curve and line, by={a}}];
\draw[dashed]
  (a) -- (a|-{axis cs:0,0}) node[anchor=north,font=\tiny] {$N=1$};
\node[fill,inner sep=1.5pt] at (a) {};
\end{axis}
\end{tikzpicture}
\end{figure}
請注意,我只嘗試在這裡指向 N1,但即使這樣也不起作用。另外,我不想僅僅為了交叉而繪製一條線,但我不知道如何以另一種方式做。
有什麼建議嗎?
答案1
Alenanno 答案的替代方案,在節點處有節點名稱:
\documentclass[margin=10pt]{standalone}
    \usepackage{pgfplots}
    \pgfplotsset{compat=1.13}

\begin{document}
    \begin{tikzpicture}[scale=1.5,
X/.style = {circle, fill=black, inner sep=1.5pt,
            label={[font=\scriptsize]above right:#1},
            node contents={}}
                    ]
\begin{axis}[
    domain=10:1,
    axis lines=left,
    grid=both,
    clip=false,
    xlabel=\textit{Tempo (dias)},
    ylabel=\textit{Atividade (Ci)}
]
\addplot[smooth,thick,black]{100*exp(-x*ln(2)/2)};
%
\draw[dashed] (1,50) -- (2,50) node[X={$N=1$}] -- (2,3);
\draw[dashed] (1,25) -- (4,25) node[X={$N=2$}] -- (4,3);
\end{axis}
    \end{tikzpicture}
\end{document}
在上面的程式碼中,我認為最近的pgfplots套件是可用的。如果是 1.11 版本之前的版本,則應新增座標axis cs:,例如(axis cs:1,25).

答案2
通常你需要交叉點才能做好工作。還會有其他解決方案,但我能想到的解決方案需要的程式碼比單純的交叉點還要多。不過,就您而言,您甚至不需要交叉點。你可以只畫線。
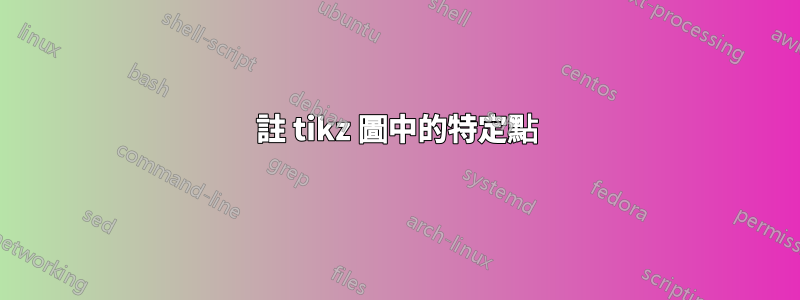
輸出

程式碼
\documentclass[margin=10pt]{standalone}
\usepackage{pgfplots}

\pgfplotsset{compat=1.13}

\tikzset{
    dot/.style={fill=black, circle, inner sep=1.5pt},
    nod/.style={sloped, at start, xshift=3mm, font=\scriptsize, above},
}

\begin{tikzpicture}[scale=1.5]
\begin{axis}[
    domain=10:1,
    axis lines=left,
    grid=both,
    clip=false,
    xlabel=Tempo (dias),
    ylabel=Atividade (Ci)
]
\addplot[name path=curve,smooth,thick,black]{100*exp(-x*ln(2)/2)};

\draw[dashed] (2,5) -- (2,50) coordinate[dot] node[nod] {$N=1$} -- (1,50);

\draw[dashed] (4,5) -- (4,25) coordinate[dot] node[nod] {$N=2$} -- (1,25);
\end{axis}
\end{tikzpicture}
\end{document}