


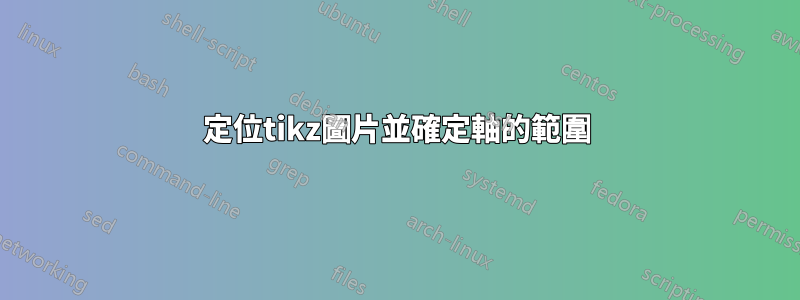
在另一個問題中,我在創建這張圖片時得到了很大的幫助:

實際上它看起來應該是這樣,但我還想澄清兩件事:
首先,我收到此警告:Axis range for axis x is approximately empty; enlarging it (it is [0.0:0.0])。我嘗試確定範圍,但找不到使所有條形仍然可見的 xmax 值。
和第二,如何確定圖片的位置?例如左對齊?任何使用 \flushleft 和 \raggedright 的嘗試都失敗。
當我按住 ctrl+點擊時,我注意到一件事\end{axis}:我猜發生了一些錯誤。我不知道邊界那邊會發生什麼事...

\documentclass[paper=a4, parskip=half-, draft]{scrreprt}

\tolerance=2000
\emergencystretch=1em
\hfuzz=2pt
\usepackage[ngerman]{babel}
\usepackage[utf8]{inputenx}
\usepackage[T1]{fontenc}
\usepackage{lmodern}

\usepackage{graphicx}
\usepackage{tikz}
\usepackage{pgfplots}
\usetikzlibrary{shapes,arrows,positioning,shadows,trees}
\pgfplotsset{compat=1.7}    %bestimmt exakte version zur gleichen

\setlength{\parindent}{0pt}
\begin{document}
        \begin{figure}[!h]
            \begin{tikzpicture}[scale=0.8]
            \begin{axis}[
            title=\textbf{Aus welchen Gründen wurde eLearning in Ihrem Klinikum implementiert?},
            ybar=15,            %Abstand zwischen den Balken
            ymin=0,
            ymax=50,            %maximale Diagrammhöhe
            xmin=0,
            xmax=,
            %ymajorgrids,       %Horizontale Guidelines
            bar width=30pt,     %Balkenbreite
            xtick=\empty,       %keine kleinen Striche auf x achse
            nodes near coords={\pgfmathprintnumber\pgfplotspointmeta \%},           %Fügt Prozent an
            nodes near coords align={vertical},
            legend style={
                legend pos=outer north east,
                row sep=10pt,
                /tikz/nodes={text width=135pt,text depth=}
            }]

            \addplot coordinates{(0,31.1)};
            \addlegendentry{Aufgrund der gesetzlichen Nachweispflicht (Brandschutz, Arbeitsschutz, etc.)}

            \addplot coordinates{ (0,17.8)};
            \addlegendentry{Einweisung zur Nutzung medizinischer Geräte}

            \addplot coordinates{ (0,44.4)};
            \addlegendentry{Zur generellen zeit- und ortsungebundenen Weiterbildung von Mitarbeitern}

            \addplot coordinates{ (0,6.7)};
            \addlegendentry{Sonstige}

            \end{axis}
            \end{tikzpicture}
        \end{figure}

\end{document}
我很感激任何幫助!
答案1
第一:您可以忽略警告或您將xmin和xmax對稱設定為0。例如:xmin=-1和xmax=1。
第二:圖片的邊界框被長繪圖標題向左放大。所以\raggedright情節標題是左對齊的。所以你必須改變情節標題的位置。

代碼:
\documentclass[paper=a4, parskip=half-, draft]{scrreprt}
\usepackage{showframe}% show the page layout

\usepackage[ngerman]{babel}
\usepackage[utf8]{inputenx}
\usepackage[T1]{fontenc}
\usepackage{lmodern}

\usepackage{pgfplots}
\pgfplotsset{compat=1.7}    %bestimmt exakte version zur gleichen

%\setlength{\parindent}{0pt}% <- not needed because you use parskip=half- option
\begin{document}
\begin{figure}[!h]
    \begin{tikzpicture}[scale=0.8]
    \begin{axis}[
    title=\textbf{Aus welchen Gründen wurde eLearning in Ihrem Klinikum implementiert?},
    title style={at={(0,1)},anchor=south west,inner xsep=0pt},% <- added
    ybar=15,            %Abstand zwischen den Balken
    ymin=0,
    ymax=50,            %maximale Diagrammhöhe
    xmin=-1,% <-changed
    xmax=1,% <- changed
    %ymajorgrids,       %Horizontale Guidelines
    bar width=30pt,     %Balkenbreite
    xtick=\empty,       %keine kleinen Striche auf x achse
    nodes near coords={\pgfmathprintnumber\pgfplotspointmeta \%},           %Fügt Prozent an
    nodes near coords align={vertical},
    legend style={
        legend pos=outer north east,
        row sep=10pt,
        /tikz/nodes={text width=135pt,text depth=}
    }]

    \addplot coordinates{(0,31.1)};
    \addlegendentry{Aufgrund der gesetzlichen Nachweispflicht (Brandschutz, Arbeitsschutz, etc.)}

    \addplot coordinates{ (0,17.8)};
    \addlegendentry{Einweisung zur Nutzung medizinischer Geräte}

    \addplot coordinates{ (0,44.4)};
    \addlegendentry{Zur generellen zeit- und ortsungebundenen Weiterbildung von Mitarbeitern}

    \addplot coordinates{ (0,6.7)};
    \addlegendentry{Sonstige}

    \end{axis}
    \end{tikzpicture}
\end{figure}
\end{document}
或者如果情節標題應該以情節為中心和傳奇

代碼:
\documentclass[paper=a4, parskip=half-, draft]{scrreprt}
\usepackage{showframe}% show the page layout

\usepackage[ngerman]{babel}
\usepackage[utf8]{inputenx}
\usepackage[T1]{fontenc}
\usepackage{lmodern}

\usepackage{pgfplots}
\pgfplotsset{compat=1.7}    %bestimmt exakte version zur gleichen

%\setlength{\parindent}{0pt}% <- not needed because you use parskip=half- option
\begin{document}
\begin{figure}[!h]
    \begin{tikzpicture}[scale=0.8]
    \begin{axis}[
    %title=\textbf{Aus welchen Gründen wurde eLearning in Ihrem Klinikum implementiert?},% <- removed
    ybar=15,            %Abstand zwischen den Balken
    ymin=0,
    ymax=50,            %maximale Diagrammhöhe
    xmin=-1,% <-changed
    xmax=1,% <- changed
    %ymajorgrids,       %Horizontale Guidelines
    bar width=30pt,     %Balkenbreite
    xtick=\empty,       %keine kleinen Striche auf x achse
    nodes near coords={\pgfmathprintnumber\pgfplotspointmeta \%},           %Fügt Prozent an
    nodes near coords align={vertical},
    legend style={
        legend pos=outer north east,
        row sep=10pt,
        /tikz/nodes={text width=135pt,text depth=}
    }]

    \addplot coordinates{(0,31.1)};
    \addlegendentry{Aufgrund der gesetzlichen Nachweispflicht (Brandschutz, Arbeitsschutz, etc.)}

    \addplot coordinates{ (0,17.8)};
    \addlegendentry{Einweisung zur Nutzung medizinischer Geräte}

    \addplot coordinates{ (0,44.4)};
    \addlegendentry{Zur generellen zeit- und ortsungebundenen Weiterbildung von Mitarbeitern}

    \addplot coordinates{ (0,6.7)};
    \addlegendentry{Sonstige}

    \end{axis}
    \node[anchor=south,font=\bfseries\footnotesize]at (current bounding box.north){Aus welchen Gründen wurde eLearning in Ihrem Klinikum implementiert?};% <- added
    \end{tikzpicture}
\end{figure}
\end{document}