


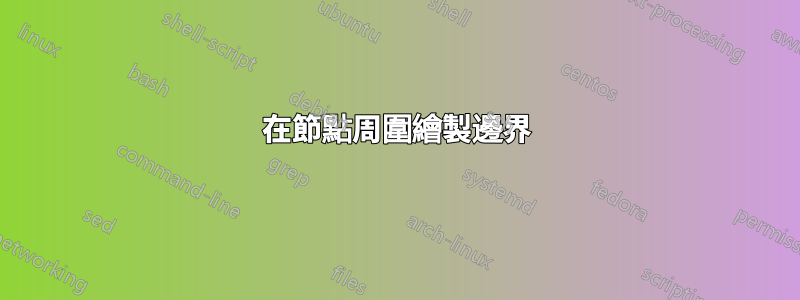
我有一個像附圖一樣的圖,它是由下面的程式碼產生的。我想畫一個虛線邊界如圖所示,圍繞著一些節點。最好的方法是什麼?任何提示都將受到高度讚賞。謝謝。
\documentclass{article}

\usepackage{tikz}
\usepackage{caption}
\usepackage{pgfplots}
\usepackage{amsmath}
\usepackage{graphicx}

\begin{document}


\begin{figure}
\begin{tikzpicture}
\pgfplotsset{every axis legend/.append style={
at={(0.23,0.74)},
anchor=south}}
\begin{axis}[ xlabel = Field X Axis, ylabel = Field Y Axis  ,  xtick ={0, 50, 100}, ytick ={0, 50, 100}, legend entries ={Node, MC's Position, Base Station}]
\addplot[ gray, only marks] coordinates {(10,15) (10, 60) (2,55) (17, 16) (17,25) (1, 21) (5,45) (83, 10) (56,35) (25, 40)};
\addplot[orange, only marks, mark=square*, mark size=4] coordinates {(0,60) (60,80) (85,15)};
\addplot[cyan, only marks, mark=triangle*, mark size=7] coordinates {(0,5)};

\addplot[no markers, dashed, cyan] coordinates {(0,5) (0, 60)};
\addplot[no markers, dashed, cyan] coordinates {(0,5)(85,15)};
\addplot[no markers, dashed, cyan] coordinates {(0,5) (60,80)};

\end{axis}
\end{tikzpicture}
\caption{System Overview of  WRSN}
\end{figure}


\end{document}

答案1
一種可能的方法是命名座標,您可以在座標周圍繪製虛線,並選擇適合所選座標的節點形狀。為此,fit必須在文件序言中新增 TikZ 庫:

\documentclass{article}
\usepackage{caption}
\usepackage{pgfplots}
\pgfplotsset{width=11cm,compat=1.13} % <--- added
\usetikzlibrary{fit,shapes.geometric}% <--- added
\usepackage{amsmath}
\usepackage{graphicx}

% for show figure only
\usepackage[active,floats,tightpage]{preview}
    \setlength\PreviewBorder{1em}

\begin{document}
    \begin{figure}[h]
\begin{tikzpicture}
\pgfplotsset{every axis legend/.append style={
at={(0.23,0.74)},
anchor=south}}
\begin{axis}[ xlabel = Field X Axis, ylabel = Field Y Axis  ,  xtick ={0, 50, 100}, ytick ={0, 50, 100}, legend entries ={Node, MC's Position, Base Station}]
\addplot[ gray, only marks] coordinates {(10,15) (10, 60) (2,55) (17, 16) (17,25) (1, 21) (5,45) (83, 10) (56,35) (25, 40)};
\addplot[orange, only marks, mark=square*, mark size=4] coordinates {(0,60) (60,80) (85,15)};
\addplot[cyan, only marks, mark=triangle*, mark size=7] coordinates {(0,5)};

\addplot[no markers, dashed, cyan] coordinates {(0,5) (0, 60)};
\addplot[no markers, dashed, cyan] coordinates {(0,5)(85,15)};
\addplot[no markers, dashed, cyan] coordinates {(0,5) (60,80)};

%%%% added
\coordinate (a) at (1, 21);
\coordinate (b) at (10,15);
\coordinate (c) at (17,16);
\coordinate (d) at (17,25);
    \node[ellipse, draw, thick, dotted,
          fit=(a) (b) (c) (d)] {};
%%%%
\end{axis}
\end{tikzpicture}
\caption{System Overview of  WRSN}
    \end{figure}
\end{document}
附錄:無需命名座標也可以獲得相同的結果:
%%%% added
\node[ellipse, draw, thick, dotted,
      fit={(1, 21) (10,15) (17,16) (17,25)}] {};% <-- field of coordinates are inside {  }
%%%%