


我有一些與關係相關的數據,y = B*exp(Cx)
我希望能夠繪製數據並根據關係確定值:
ln(y) = ln(B) + Cx
x我有和的原始資料值y。我希望繪製它們並在圖表上畫一條最佳擬合線,並顯示最佳擬合線的方程,以確定 y 截距等於ln(B)並因此確定B
到目前為止我有這個
\begin{document}
\begin{tikzpicture}
    \begin{semilogyaxis}
        \addplot table[x={x}, y={y}] {
        x      y
        0.284  0.01
        0.433  0.59
        0.485  2.97
        0.500  3.96
        0.531  9.48
        0.558  18.00
        0.597  45.00
        0.621  94.00
        0.696  1136.00
        };
    \end{semilogyaxis}
\end{tikzpicture}
\end{document}
它繪製了數據,儘管在 log 10 圖上不是我想要的自然對數。
我努力了
\addplot table[x={x}, y={create col/linear regression={y=y}}] {data.dat};
但無濟於事。
我正在使用最新版本的 pgf 圖,如果不在半對數軸上,迴歸線確實可以工作。
答案1
我認為問題出在您未在序言中載入的套件中。以您的範例(基本上逐字)為例,並添加適當的包對我有用。
關於等式,您可以透過\pgfplotstableregressiona和來存取它們\pgfplotstableregressionb,我們可以透過簡單地解析數字來將 必須 轉換a x + b為。A e^{B x}請注意,它\pgfmathresult一直被寫入,因此為什麼我\fitb一完成計算就將其寫入。如果你有:
\pgfmathparse{exp(\pgfplotstableregressionb)}
\addlegendentry{Fit: \(\pgfmathresult e^{\pgfmathprintnumber{\pgfplotstableregressiona} \cdot x}\)}
那麼你不能保證\pgfmathresult仍然包含求冪的結果(事實上,你會發現它不包含)。
這是完整的範例:
\documentclass[tikz]{standalone}

\usepackage{tikz}
\usepackage{pgfplots}
\usepackage{pgfplotstable}
\pgfplotsset{compat=1.13}

\begin{filecontents*}{data.dat}
  x      y
  0.284  0.01
  0.433  0.59
  0.485  2.97
  0.500  3.96
  0.531  9.48
  0.558  18.00
  0.597  45.00
  0.621  94.00
  0.696  1136.00
\end{filecontents*}

\begin{document}
\begin{tikzpicture}
  \begin{semilogyaxis}[
        legend pos=outer north east,
      ]
    \addplot table[x={x}, y={y}] {data.dat};
    \addlegendentry{Data}
    \addplot table[x={x}, y={create col/linear regression={y=y}}] {data.dat};
    \pgfset{/pgf/fpu=true}
    \pgfmathparse{exp(\pgfplotstableregressionb)}
    \pgfmathprintnumberto{\pgfmathresult}{\fitb}
    \addlegendentry{Fit: \(\fitb e^{\pgfmathprintnumber{\pgfplotstableregressiona} \cdot x}\)}
    \pgfset{/pgf/fpu=false}
  \end{semilogyaxis}
\end{tikzpicture}
\end{document}
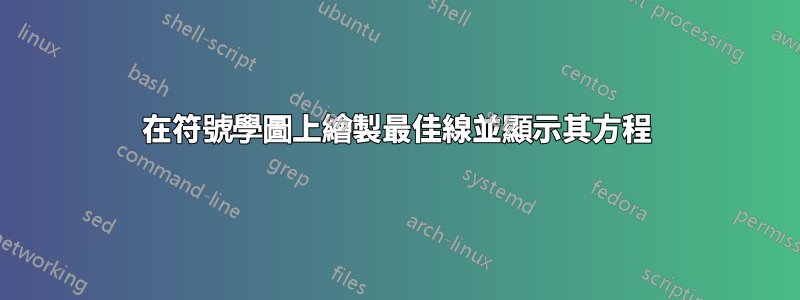
輸出:
