


我創建了一個 npm 套件來輕鬆編寫 TIKZ 流程圖。 Flowtex 有助於流程圖的維護。例如插入新節點或將節點定位為其他節點的函數。我希望它對你和我一樣有用。
https://www.npmjs.com/package/flowtex
在 github 上使用 flowtex.sty基於使用 TikZ 建立流程圖
流程圖
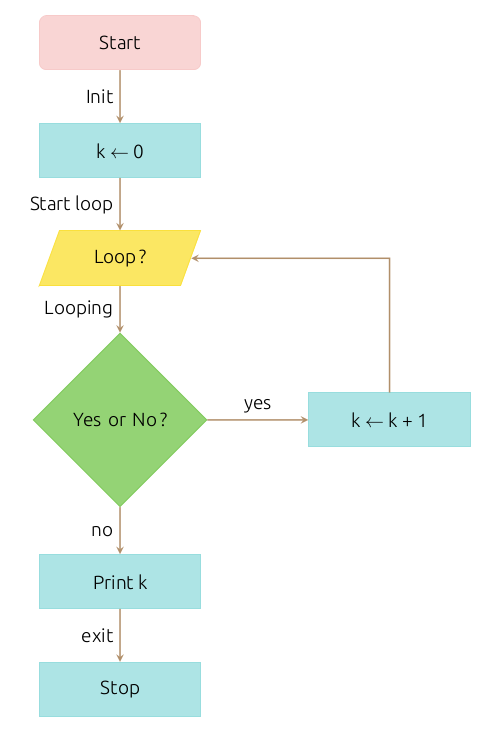
Flowtex程式碼
flowchart.offsetX("3");
  N('Start').belowGoto(
    P('k <- 0').belowGoto(
      loop = IO('Loop ?').belowGoto(
        D('Yes or No ?').offsetY(-1) // use offsetY with D
         .rightGoto(kp1 = P('k <- k + 1')).topLabel('yes')
         .belowGoto( // use offsetY for this node because is immediatly below of D
          P('Print k').offsetY(-1).belowGoto(
            P('Stop')
          ).leftLabel('exit')
        ).leftLabel('no')
      ).leftLabel('Looping')
    ).leftLabel('Start loop')
  ).leftLabel('Init');
  kp1.goto(loop).brokenArrow();
使用 TIKZ 的 LaTeX 程式碼
\begin{center}
  \begin{tikzpicture}[node distance=2cm]
    \node (node0) [startstop] {Start};
    \node (node1) [process, below of=node0] {k $\leftarrow$ 0};
    \node (node2) [io, below of=node1] {Loop ?};
    \node (node3) [decision, below of=node2, yshift=-1cm] {Yes or No ?};
    \node (node4) [process, right of=node3, xshift=3cm] {k $\leftarrow$ k + 1};
    \node (node5) [process, below of=node3, yshift=-1cm] {Print k};
    \node (node6) [process, below of=node5] {Stop};
    \draw [arrow] (node3) --node[anchor=south] {yes} (node4);
    \draw [arrow] (node3) --node[anchor=east] {no} (node5);
    \draw [arrow] (node5) --node[anchor=east] {exit} (node6);
    \draw [arrow] (node2) --node[anchor=east] {Looping} (node3);
    \draw [arrow] (node1) --node[anchor=east] {Start loop} (node2);
    \draw [arrow] (node0) --node[anchor=east] {Init} (node1);
    \draw [arrow] (node4) |- (node2);
  \end{tikzpicture}
\end{center}
目前我使用 \input 插入生成的 LaTeX 程式碼。但是,我想建立一個像這樣的 LaTeX 命令:
\begin{flowtex}
Here, the Flowtex code.
\end{flowtex}
你知道該怎麼做嗎?
答案1
@A.Ellet 答案的替代方案(兩者都考慮您問題的第一個版本):
 \documentclass[border=3mm,
                tikz]{standalone}
\usetikzlibrary{arrows.meta,
                calc, chains,
                quotes,
                positioning,
                shapes.geometric}

\begin{document}
  \begin{tikzpicture}[
    node distance = 8mm and 16mm,
      start chain = A going below,
      base/.style = {draw, minimum width=32mm, minimum height=8mm,
                     align=center, on chain=A},
 startstop/.style = {base, rounded corners, fill=red!30},
   process/.style = {base, fill=orange!30},
        io/.style = {base, trapezium,
                     trapezium left angle=70, trapezium right angle=110,
                     fill=blue!30},
  decision/.style = {base, diamond, fill=green!30},
  every edge quotes/.style = {auto=right}]
                    ]
\node [startstop]       {Start};            % <-- A-1
\node [process]         {k $\gets$ 0};
\node [io]              {Loop ?};
\node [decision]        {Yes or No ?};
\node [process]         {Print k};
\node [process]         {Stop};             % <-- A-6
%
\node [process,                             % <-- A-7
       right=of A-4]    {k $\gets$ k + 1};
%%
\draw [arrows=-Stealth]
    (A-1) edge["init"]          (A-2)
    (A-2) edge["start stop"]    (A-3)
    (A-3) edge["looping"]       (A-4)
    (A-4) edge["no"]            (A-5)
    (A-5) edge["exit"]          (A-6)
    (A-4) edge["yes"']          (A-7)       % <-- by ' is swapped label position
    (A-7) |- ($(A-2.south east)!0.5!(A-3.north east)$)
          -| ([xshift=7mm] A-3.north);
  \end{tikzpicture}
\end{document}
透過比較兩種解決方案,您可以觀察到以下主要差異:
- 主分支中的節點設定為鏈(這大大簡化了程式碼)
- 對於節點名稱,使用由鏈定義的名稱
- 為節點的公共參數定義了名為的新樣式
base - 用於在節點之間繪製邊緣使用
quotes包,透過該包編寫邊緣標籤的語法大大縮短了所需的程式碼。
上述 MWE(最小工作範例)的編譯產生了與 @A.Ellett 答案中所示類似的圖片,但有重要的區別:反饋邊緣繪製得更正確(根據我的意見)。

答案2
你的 MWE 缺少了很多東西:你正在使用哪些函式庫等等。我複製了你的程式碼,然後抄襲了其餘的這個網頁。
除了顏色之外,以下程式碼應該可以滿足您的要求。
\documentclass[border=4pt]{standalone}
\usepackage{tikz}
\usetikzlibrary{calc}
\usetikzlibrary{shapes.geometric}
\usetikzlibrary{arrows.meta}
\begin{document}

  \begin{tikzpicture}[
    node distance=2cm,
    startstop/.style={rectangle, rounded corners, minimum width=3cm, minimum height=1cm,text centered, draw=black, fill=red!30},
    process/.style={rectangle, minimum width=3cm, minimum height=1cm, text centered, draw=black, fill=orange!30},
    io/.style={trapezium, trapezium left angle=70, trapezium right angle=110, minimum width=3cm, minimum height=1cm, text centered, draw=black, fill=blue!30},
    decision/.style={diamond, minimum width=3cm, minimum height=1cm, text centered, draw=black, fill=green!30},
    ]

    \node (node0) [startstop]                             {Start};
    \node (node1) [process, below of=node0]               {k $\leftarrow$ 0};
    \node (node2) [io, below of=node1]                    {Loop ?};
    \node (node3) [decision, below of=node2, yshift=-1cm] {Yes or No ?};
    \node (node4) [process, right of=node3, xshift=3cm]   {k $\leftarrow$ k + 1};
    \node (node5) [process, below of=node3, yshift=-1cm]  {Print k};
    \node (node6) [process, below of=node5]               {Stop};

    \draw [arrows=-Stealth] (node3) --node[anchor=south]            {yes}        (node4);
    \draw [arrows=-Stealth] (node3) --node[anchor=east]             {no}         (node5);
    \draw [arrows=-Stealth] (node5) --node[anchor=east]             {exit}       (node6);
    \draw [arrows=-Stealth] (node2) --node[anchor=east]             {Looping}    (node3);
    \draw [arrows=-Stealth] (node1) --node[anchor=east]             {Start loop} (node2);
    \draw [arrows=-Stealth] (node0) --node[anchor=east]             {Init}       (node1);
    \draw [arrows=-Stealth] (node4) -- (node2);

  \end{tikzpicture}

\end{document}

我將留給您調整其餘部分以獲得您想要的顏色(畢竟,我是色盲)。