


我想弄清楚為什麼我無法在節點之間水平居中繪製一條藍色實線?
\documentclass{article}
\usepackage{tikz,amsmath}
\usetikzlibrary{positioning}
\begin{document}
\begin{center}
\begin{tikzpicture}
\node(X)[draw,rectangle, rounded corners,draw=black,
          fill=white,align=center,xshift=-6cm]
          {\large Input \textcolor{red}{$2$}};%
\node(Y)[draw,rectangle, rounded corners,draw=black,
          fill=white,align=center,xshift=-.5cm]
          {\large $\begin{aligned}[t] g(\textcolor{red}
    {2})&=\textcolor{red}{2}^{2}+1\\ &=5\end{aligned}$\\
    \large The output of $g$, \textcolor{blue}{$5$},is\\
    \large the input to $f$};%
\node (Z)[draw,rectangle, rounded corners,draw=black,
          fill=white,align=center,xshift=6cm]
         {\large $\begin{aligned}[t] f(\textcolor{blue}
     {5})&=4(\textcolor{blue}{5})-3\\ &=17\end{aligned}$};%
\end{tikzpicture}
\end{center}

\begin{tikzpicture}
\draw[blue,thick,-latex] (X.east) to ( Y.west);
\end{tikzpicture}
\end{document}

答案1
假設您想要有兩個單獨的tikzpictures,則需要分別添加remember picture和overlay,remember picture。
\documentclass{article}
\usepackage{tikz,amsmath}
\usetikzlibrary{positioning}
\begin{document}
\begin{center}
\begin{tikzpicture}[remember picture]
\node(X)[draw,rectangle, rounded corners,draw=black,
          fill=white,align=center,xshift=-6cm]
          {\large Input \textcolor{red}{$2$}};%
\node(Y)[draw,rectangle, rounded corners,draw=black,
          fill=white,align=center,xshift=-.5cm]
          {\large $\begin{aligned}[t] g(\textcolor{red}
    {2})&=\textcolor{red}{2}^{2}+1\\ &=5\end{aligned}$\\
    \large The output of $g$, \textcolor{blue}{$5$},is\\
    \large the input to $f$};%
\node (Z)[draw,rectangle, rounded corners,draw=black,
          fill=white,align=center,xshift=6cm]
         {\large $\begin{aligned}[t] f(\textcolor{blue}
     {5})&=4(\textcolor{blue}{5})-3\\ &=17\end{aligned}$};%
\end{tikzpicture}
\end{center}

\begin{tikzpicture}[overlay,remember picture]
\draw[blue,thick,-latex] (X.east) to ( Y.west);
\end{tikzpicture}
\end{document}
當然,您可以只使用一個tikzpicture。
\documentclass{article}
\usepackage{tikz,amsmath}
\usetikzlibrary{positioning}
\begin{document}
\begin{center}
\begin{tikzpicture}
\node(X)[draw,rectangle, rounded corners,draw=black,
          fill=white,align=center,xshift=-6cm]
          {\large Input \textcolor{red}{$2$}};%
\node(Y)[draw,rectangle, rounded corners,draw=black,
          fill=white,align=center,xshift=-.5cm]
          {\large $\begin{aligned}[t] g(\textcolor{red}
    {2})&=\textcolor{red}{2}^{2}+1\\ &=5\end{aligned}$\\
    \large The output of $g$, \textcolor{blue}{$5$},is\\
    \large the input to $f$};%
\node (Z)[draw,rectangle, rounded corners,draw=black,
          fill=white,align=center,xshift=6cm]
         {\large $\begin{aligned}[t] f(\textcolor{blue}
     {5})&=4(\textcolor{blue}{5})-3\\ &=17\end{aligned}$};%
\draw[blue,thick,-latex] (X.east) to ( Y.west);
\end{tikzpicture}
\end{center}

\end{document}
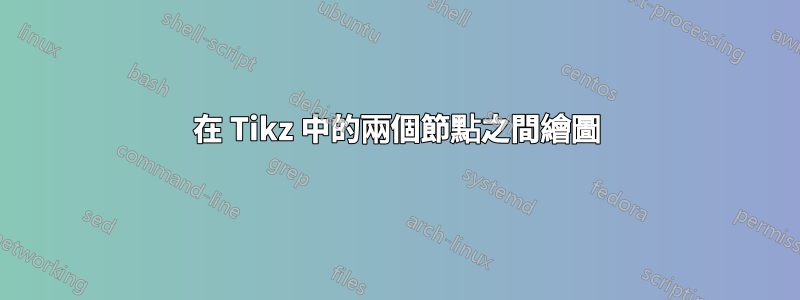
兩個程式碼的輸出都是

答案2
受到薛丁格的貓答案中第二個例子的啟發。透過使用庫chains和他的宏join,定位並定義所有節點的通用樣式:
\documentclass{article}
\usepackage{tikz,amsmath}
\usetikzlibrary{chains,
                positioning}

\begin{document}
    \begin{center}
\begin{tikzpicture}[
    node distance = 22mm,
      start chain = going right,
       box/.style = {draw, rounded corners, font=\large,
                     align=center, on chain},
every join/.style = {blue,thick,-latex}
              ]
\node (X) [box] {Input \textcolor{red}{$2$}};%
\node (Y) [box, join]
                {$\begin{aligned}[t]
                g(\textcolor{red}{2})   & = \textcolor{red}{2}^{2}+1\\
                                        & = 5
                \end{aligned}$\\
                The output of $g$, \textcolor{blue}{$5$}, \\
                is the input to $f$};
\node (Z) [box] {$\begin{aligned}[t]
                f(\textcolor{blue}{5})  & = 4(\textcolor{blue}{5})-3\\
                                        & = 17
                \end{aligned}$};%
\end{tikzpicture}
    \end{center}
\end{document}
