


我想在下圖中添加一個帶有方程式 x+y-30 的半透明垂直紅色分隔線。它應該將曲線切割成兩個部分。

\documentclass[border=10pt]{standalone}
\usepackage{pgfplots}
\usepgfplotslibrary{fillbetween}
\pgfplotsset{compat=1.17}
\begin{document}
    \begin{tikzpicture}
        \begin{axis} [
            xtick = {0,20,...,100},
            ytick = {0,20,...,60},
            ztick = {0,40,...,120},
            xlabel = $U_A$, ylabel = $U_B$, zlabel = $S$,
            zlabel style={rotate=-90},
            ticklabel style = {font = \scriptsize},
            colormap/cool
            ]
            \addplot3[name path=toppath, domain=0:30, fill=blue, opacity=0.1, fill opacity=0.4,samples=30] (x,30-x,120);
            \addplot3[name path=botpath, domain=0:30, fill=blue, opacity=0.1, fill opacity=0.4,samples=30] (x,30-x,0);
            \addplot [red] fill between[of=toppath and botpath];
            \addplot3 [surf, shader=interp, domain=0:100, domain y=0:60, samples=56]
            { ln((100!/(x!*(100-x)!))*(60!/(y!*(60-y)!))) };
        \end{axis}
    \end{tikzpicture}
\end{document}
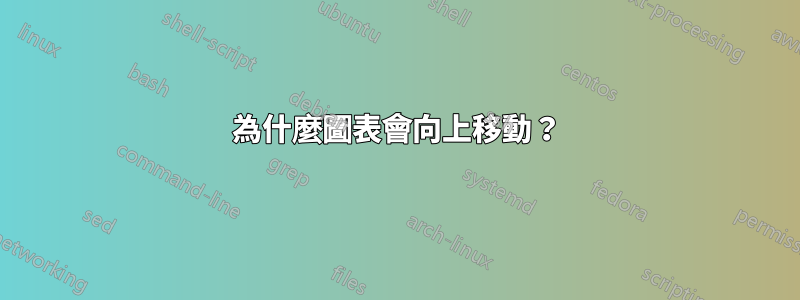
當我運行程式碼時,我得到了這個奇怪的結果

我不明白為什麼原始曲線會向上移動。
這就是我想看到的

(另外,我想知道更改視圖的最佳方法是什麼。我想從查看框左角的角度查看圖形。)
答案1
不幸的是,這種覆蓋在pgfplots.唯一的解是分別繪製曲面的不同部分,在本例中是相交平面,以正確的順序繪製,以便它們正確重疊。若要在非矩形域上繪製函數,必須將要使用的域進行參數化。在這種情況下,從上面看,我們將有一個三角形和一個多邊形。

給定頂點參數化三角形很簡單,但對於多邊形來說可能很複雜。我認為最簡單的解決方案是將多邊形分成額外的三角形。

要參數化三角形,給定三個頂點、
和
,您可以使用以下參數化:
獲得這些值後,我們現在可以繪製所有曲面以獲得完整的曲面。另外,還需要設定較高的取樣率,否則,由於低品質渲染導致邊緣不規則,會導致部分錶面的連接處出現間隙。這是一個要求非常高的解決方案,因此以下是使用shell-escape選項的程式碼和結果圖gnuplot。
僅使用pgfplots:
\documentclass[border=10pt]{standalone}

\usepackage{pgfplots}
\pgfplotsset{compat=newest}

\begin{document}

    \begin{tikzpicture}
        \begin{axis} [
            xtick = {0,20,...,100},
            ytick = {0,20,...,60},
            ztick = {0,40,...,120},
            xlabel = $U_A$, ylabel = $U_B$, zlabel = $S$,
            zlabel style={rotate=-90},
            ticklabel style = {font = \scriptsize},
            colormap/cool,
            variable=s,
            variable y=t,
            domain=0:1,
            view/h=15,
            ]
\addplot3 [surf, shader=interp, samples=80, samples y=80] ({100-100*s},{-30*s-30*t*s+60},{ ln((100!/(x!*(100-x)!))*(60!/(y!*(60-y)!))) }); %B

\addplot3 [surf,shader=interp, samples=30, samples y=30,] ({100*t*s+30-30*s},{30*s+30*t*s},{ ln((100!/(x!*(100-x)!))*(60!/(y!*(60-y)!))) }); %C

\addplot3 [surf, shader=interp, samples=30, samples y=30,] ({100+70*t*s-70*s},{60*t*s},{ ln((100!/(x!*(100-x)!))*(60!/(y!*(60-y)!))) }); %D

\addplot3 [patch, fill=red, patch type=rectangle] coordinates {(0,30,120) (30,0,120)  (30,0,0) (0,30,0)};

\addplot3 [surf, shader=interp, samples=30, samples y=30] ({30-30*s},{30*s*t},{  ln((100!/(x!*(100-x)!))*(60!/(y!*(60-y)!))) }); %A

       \end{axis}
    \end{tikzpicture}

\end{document}

使用pgfplots和gnuplot:
\documentclass[border=10pt, convert={true}]{standalone}

\usepackage{pgfplots}
\pgfplotsset{compat=newest}

\begin{document}

    \begin{tikzpicture}
        \begin{axis} [
            xtick = {0,20,...,100},
            ytick = {0,20,...,60},
            ztick = {0,40,...,120},
            xlabel = $U_A$, ylabel = $U_B$, zlabel = $S$,
            zlabel style={rotate=-90},
            ticklabel style = {font = \scriptsize},
            colormap/cool,
            view/h=15,
            ]

           \addplot3[surf, shader=interp, thick ]  gnuplot [ raw gnuplot, id=B ]  {
           set samples 60,60;
           set isosamples 60,60;
           set parametric;
           fx(u,v)=100-100*u;
           fy(u,v)=-30*u-30*v*u+60;
           fz(u,v)= log((100!/((int((100-100*u)))!*(100-int((100-100*u)))!))*(60!/((int((-30*u-30*v*u+60)))!*(60-int((-30*u-30*v*u+60)))!)));
           splot [0:1][0:1] fx(u,v), fy(u,v), fz(u,v)}; %B

            \addplot3[surf, shader=interp]  gnuplot [ raw gnuplot, id=C]  {
           set samples 60,60;
           set isosamples 60,60;
           set parametric;
           gx(u,v)=100*v*u+30-30*u;
           gy(u,v)=30*u+30*v*u;
           gz(u,v)= log((100!/((int(100*v*u+30-30*u))!*(100-int(100*v*u+30-30*u))!))*(60!/((int(30*u+30*v*u))!*(60-int(30*u+30*v*u))!)));
           splot [0:1][0:1] gx(u,v), gy(u,v), gz(u,v) }; %C

           \addplot3[surf, shader=interp]  gnuplot [ raw gnuplot, id=D]  {
    set samples 60,60;
    set isosamples 60,60;
           set parametric;
           hx(u,v)=100+70*v*u-70*u;
           hy(u,v)= 60*v*u;
           hz(u,v)=log((100!/((int(100+70*v*u-70*u))!*(100-int(100+70*v*u-70*u))!))*(60!/((int(60*v*u))!*(60-int(60*v*u))!)));
           splot [0:1][0:1] hx(u,v), hy(u,v), hz(u,v) }; %D

                        \addplot3 [patch, fill=red, patch type=rectangle] coordinates {(0,30,120) (30,0,120)  (30,0,0) (0,30,0)};

                        \addplot3[surf, shader=interp]  gnuplot [raw gnuplot, id=A ]  {
                        set samples 60,60;
                        set isosamples 60,60;
                        set parametric;
                        splot [0:1][0:1] 30-30*u,30*u*v,log((100!/((int(30-30*u))!*(100-int(30-30*u))!))*(60!/((int(30*u*v))!*(60-int(30*u*v))!)))   }; %A


       \end{axis}
    \end{tikzpicture}

\end{document}

要變更視圖,您可以使用該view/h= angle選項,記住相應地調整曲面的順序以實現正確的重疊。
兩種方法的渲染存在一些差異。我還沒能取得更好的結果,但請隨意調整採樣,看看是否能找到更好的組合。