


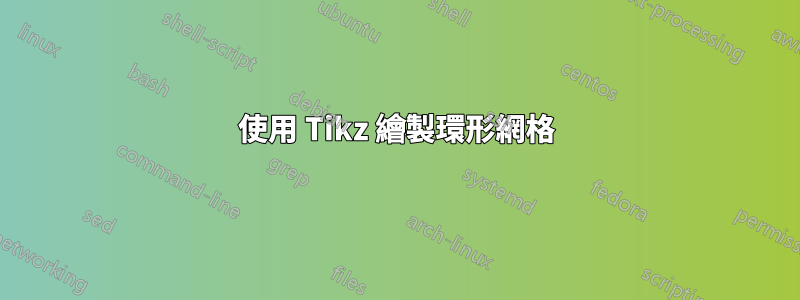
我正在嘗試在我正在編寫的報告中可視化一些網格轉換。我對所附圖中的左側網格感到滿意,現在我需要建立一個網格化的環,如右側所示。重要的是他們擁有相同的點數。由於左邊的點是 10×10,所以右邊的點沿著圓週應有 10 個點,沿著牆法線方向應有 10 個點。

這是我用來產生左側程式碼的程式碼:
\documentclass{article}
\usepackage{tikz}
\usetikzlibrary{arrows.meta}
\usetikzlibrary{calc}

\begin{document}
\begin{figure}[h!]
    \centering
    \begin{tikzpicture}
        \coordinate (A) at (0,0);
        \coordinate (B) at (3,0);
        \coordinate (C) at (3,3);
        \coordinate (D) at (0,3);

        \foreach [evaluate=\i as \x using \i/10] \i in {0,...,10}
        {
            \draw ($(A)!\x!(B)$) arc -- ($(D)!\x!(C)$);
            \draw ($(A)!\x!(D)$) -- ($(B)!\x!(C)$);
        }
        \draw[->, >= Latex] (-0.1, -0.1) -- (1, -0.1);
        \draw[->, >= Latex] (-0.1, -0.1) -- (-0.1, 1);
        \draw[->, >= Latex] (-0.1, -0.1) -- (0.5, 0.5);
        \node[] at (1, -0.35) (y) {$\zeta$};
        \node[] at (-0.35, 1) (x) {$\eta$};
        \node[] at (-0.35, -0.10) (x) {$\xi$};
        \draw[->, >= Latex] (3.5, 1.5) -- (4.5, 1.5);
    \end{tikzpicture}
    \caption{Visualisation of a mapping from a computational grid to a physical space using 2D section.}
\end{figure}
\end{document}
你有什麼建議嗎?
謝謝!
答案1
更新:重讀你的問題後,我意識到你想要一個圓環,而不是一個環面。scope將原始程式碼中的此處替換為:
\begin{scope}[shift={(7,1.5)}]
    \foreach \t in {0,...,10}{
        \draw (0,0) circle[radius=1+.1*\t];
        \draw (36*\t:1)--(36*\t:2);
    }
\end{scope}

我假設您只需要 5 個可見的縱向區域,因為其他 5 個區域位於背面。
原解決方案:
一些建議:
- 用於
grid簡化矩形網格的程式碼。 - 可以將節點包含在
\draw命令中以簡化放置。 - A
scope可以使計算更容易,允許使用極座標作為環面。

\documentclass{article}

\usepackage{tikz}
\usetikzlibrary{arrows.meta}

\begin{document}

\begin{figure}[h!]
    \centering
        \begin{tikzpicture}
        \draw[step=3mm] (0,0)grid(3,3);
        \draw[-Latex] (-0.1, -0.1) -- (1, -0.1) node[below]{$\zeta$};
        \draw[-Latex] (-0.1, -0.1) -- (-0.1, 1) node[left]{$\eta$};
        \draw[-Latex] (-0.1, -0.1) node[left]{$\xi$} -- (0.5, 0.5);

        \draw[-Latex] (3.5, 1.5) -- (4.5, 1.5);
        \begin{scope}[shift={(7,1.5)}]
            \foreach \t in {0,36,...,360}{
                \draw (0,0) circle[radius=1.5+.5*cos(\t)];
                \draw (\t:1)--(\t:2);
            }
        \end{scope}
    \end{tikzpicture}
    \caption{Visualisation of a mapping from a computational grid to a physical space using 2D section.}
\end{figure}

\end{document}