


正如標題所說,我想從整數值建立一個直方圖。我的 MWE 是:
\documentclass[border=5]{standalone}

\usepackage{pgfplots}
%Random data between 10 and 20 -- could also be between 100 and 200 or what ever
\begin{filecontents*}{data.txt}
        18
        15
        18
        19
        14
        15
        12
        11
        18
        18
        12
        11
        17
\end{filecontents*}

\begin{document}
    \begin{tikzpicture}
        \begin{axis}[
            axis lines=left,
            ymajorgrids=true,
            title={Histogram},
            xlabel=points,
            ylabel=headcount,
            ybar
            ]
        \addplot+ [hist] table[y index= 0]{data.txt};
        \end{axis}
    \end{tikzpicture}
\end{document}
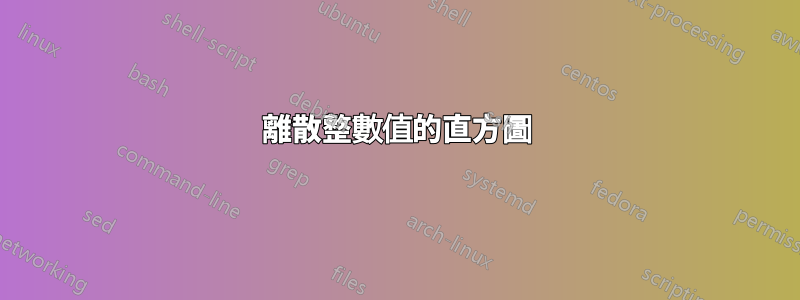
結果是:

我想要得到的是(注意:不幸的是,我已經重複計算了這些值):
](https://i.stack.imgur.com/poWRU.png)
我的問題是,x 軸不是離散的,這就是標籤移動的原因。我希望條形之間有空間 - y 軸和第一個條形之間以及最後一個條形之間也有空間。
一些附加資訊:我正在使用 LaTeX。我已經嘗試將精度設為 0 並使用 datatool 首先計算頻率,然後繪製一個簡單的條形圖。我一直在努力嘗試各種標籤和區域樣式,但無法實現我的目標。
答案1
您可以使用 gnuplot 建立直方圖數據,然後將這些數據繪製為長條圖。要編譯,您需要安裝 gnuplot 並使用以下命令進行編譯--shell-escape:--shell-escape 的作用是什麼?
\begin{filecontents*}{data.txt}
18
15
18
19
14
15
12
11
18
18
12
11
17
\end{filecontents*}
\documentclass[tikz, border=1cm]{standalone}
\usepackage{pgfplots}
\pgfplotsset{compat=1.18}
\begin{document}
\begin{tikzpicture}
\begin{axis}[
ybar,
xmin=10, xmax=20,
ymin=0,
xtick distance=1,
axis lines=left,
ymajorgrids=true,
title={Not a Histogram}, xlabel=points, ylabel=headcount,
]
\addplot+[raw gnuplot] gnuplot {
binwidth=1;
bin(x,bw)=bw*floor(x/bw);
plot "data.txt" using (bin($1,binwidth)):(1.0) smooth freq;
};
\end{axis}
\end{tikzpicture}
\end{document}

答案2
Latex3我們可以透過隨機選擇來準備數據。\intarray_new:Nn \g_HISTO_myarray_intarray {9}
儲存 1 到 9 之間的數字(11, 12, ..., 19)。寫入檔案時我們加10\jobname.data
如果我們已經準備好了一個文件或我們想要手動修改數據,我們可以修改這個文件並註釋
\histo[20]。和
pgfplotsbar width=0.5cm以免enlarge x limits={auto},enlarge y limits={upper},黏在軸上
程式碼
\documentclass[border=5mm]{standalone}
\usepackage{pgfplots}
\pgfplotsset{compat=1.18}
\ExplSyntaxOn
%%%%%%%%%%%%%%%%%%%%%%%%%%%
\sys_gset_rand_seed:n {240210}
%%%%%%%%%%%%%%%%%%%%%%%%%%%
\int_new:N \l_HISTO_randominteger_int
\intarray_new:Nn \g_HISTO_myarray_intarray {9}
\iow_new:N \g_HISTO_iow
%
\tl_new:N \l_HISTO_table_tl
\NewDocumentCommand{\histo}{O{10}}% 10 by default
    {
        \__array_fillarray:n{#1}
        \__array_table:
    }

\cs_new_protected:Nn \__array_fillarray:n
{
    \int_step_inline:nnn {1} {#1}
            {
                \int_set:Nn \l_HISTO_randominteger_int {\int_rand:nn {1} {9}}
                \intarray_gset:Nnn \g_HISTO_myarray_intarray
                    { \l_HISTO_randominteger_int }
                    {
                        \intarray_item:Nn \g_HISTO_myarray_intarray {\l_HISTO_randominteger_int} + 1
                    }
                %\int_use:N \l_HISTO_randominteger_int \quad % uncomment to see the numbers
            }
    %\intarray_log:N \g_HISTO_myarray_intarray% <-- to see the intarray in the log
}

\cs_new_protected:Nn \__array_table:
    {
        \iow_open:Nn \g_HISTO_iow {\jobname.data}
        \int_step_inline:nnn {1} {9}
            {
                \tl_clear:N \l_HISTO_table_tl
                \tl_put_right:Nn \l_HISTO_table_tl {\int_eval:n {10+##1}}%<-- between 11 and 19
                \tl_put_right:Nn \l_HISTO_table_tl {~}
                \tl_put_right:Nn \l_HISTO_table_tl {
                \intarray_item:Nn \g_HISTO_myarray_intarray {##1}}
                \iow_now:Nx \g_HISTO_iow { \l_HISTO_table_tl }
            }
        \iow_close:N \g_HISTO_iow
    }
\ExplSyntaxOff
\begin{document}
\histo[20]

\begin{tikzpicture}
    \begin{axis}[
        %width=8cm, height=8cm,
        axis lines=left,
        ybar,
        bar width=0.5cm,
        ymajorgrids=true,
        title={Histogram ?},%<-- ?
        %
        xlabel=points,
        ylabel=headcount,
        xticklabel style = {font=\small},
        xtick=data,
        enlarge x limits={auto},
        enlarge y limits={upper},
    ]
    \addplot table[y index=1]  {\jobname.data};
    \end{axis}
\end{tikzpicture}
\end{document}
