


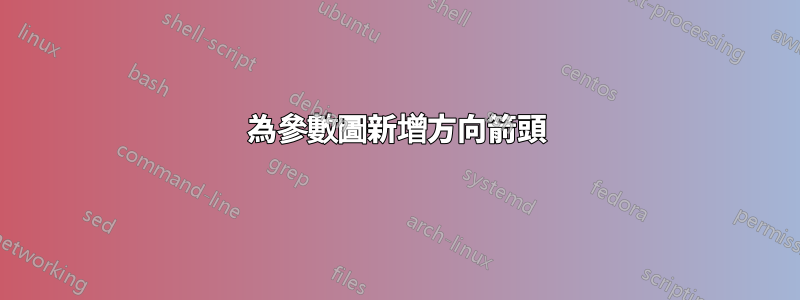
我正在嘗試沿著參數曲線的路徑添加方向箭頭。我已經弄清楚如何製作下面的曲線(忽略紅色拋物線):
\begin{document}

\section{2D Plots}

\begin{tikzpicture}

\begin{axis}[xmin=-10, xmax=10, ymin=-10, ymax=10,
axis lines=middle,
xlabel = $x$,
ylabel = $y$]

\addplot[color=red]{4-x^2};
\addplot[ domain=0:5*pi,
    samples = 120, color = blue]
({2*cos(deg(2*x))},
{4*sin(deg(3*x)});

\end{axis}

\end{tikzpicture}

\end{document}

答案1
在pgfplots的文件部分 4.17.4 在繪圖頂部放置裝飾。
Smooth繪圖在連續點之間平滑插值。隨著fpu,更精確的 veclen 函數用於裝飾。
\documentclass[border=5mm]{standalone}
%https://tex.stackexchange.com/questions/717063/adding-direction-arrows-for-a-parametric-graph
\usepackage{pgfplots}
\pgfplotsset{compat=1.18}
\usetikzlibrary{decorations.markings,fpu}
\begin{document}
\begin{tikzpicture}
    \begin{axis}[xmin=-10, xmax=10, ymin=-10, ymax=10,
            axis lines=middle,
            xlabel = $x$,
            ylabel = $y$]

        \addplot[
            /pgf/fpu/install only=veclen,smooth,%<-- added
            blue,samples=127,domain=0:5*pi,
            postaction={decorate},% ------
            decoration={markings, % ------
                    mark=between positions .0 and 1. step .25 with {\arrow{stealth}},
                    % mark=at position 0.25 with {\arrow{stealth}},
                    % mark=at position 0.5 with {\arrow{stealth}},
                    % mark=at position 0.75 with {\arrow{stealth}}
                }
        ]({2*cos(deg(2*x))},{4*sin(deg(3*x)});
    \end{axis}
\end{tikzpicture}
\end{document}
