


以下の MWE について:
\documentclass{report}
\usepackage[left=2.5cm,right=2cm,top=2cm,bottom=2cm]{geometry}
\usepackage[T1]{fontenc}
\usepackage{tikz,pgf}


\usepackage{pgfplots}
\usepackage{slashbox}
\usepackage{bchart}


\usetikzlibrary{calc,trees,positioning,arrows,chains,shapes.geometric,%
    decorations.pathreplacing,decorations.pathmorphing,shapes,%
    matrix,shapes.symbols,automata}

\begin{document}

\begin{figure}[H]
\begin{tikzpicture}
\begin{axis}[%
scaled y ticks = true,
width=1*\textwidth,
height=8cm,
xlabel={Query},
ylabel={Elapsed Time (in seconds)},
xmajorgrids,
ymajorgrids,
zmajorgrids,
enlarge x limits=0,
scaled x ticks = true]
\addplot [
color=red,
solid,
line width=1.0pt
]
coordinates{
(0,10)
(1,4)
(2,5)
};
\end{axis}
\end{tikzpicture}
\caption{Blah}
\end{figure}

\end{document}
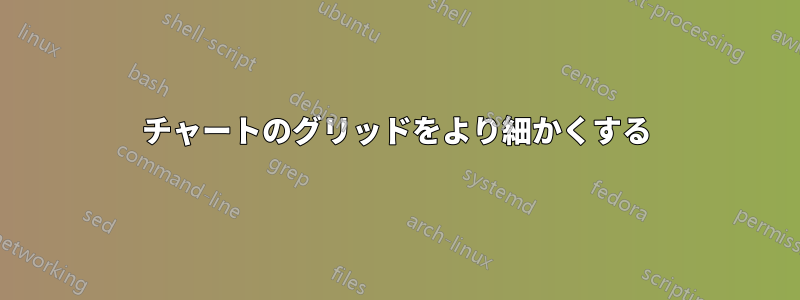
グリッドをより細かくするにはどうすればいいでしょうか?
答え1
各軸グリッドのスタイルを定義する必要はありません。grid=majorは、それらをすべて一度に設定します。また、より細かいグリッドを取得するためにマイナー ティックを導入する必要があり、grid=bothと をminor使用できますmajor。以下が十分でない場合は、y軸またはminor tickオプションに対して同じことを行うことができます。
\documentclass{report}
\usepackage[left=2.5cm,right=2cm,top=2cm,bottom=2cm]{geometry}
\usepackage[T1]{fontenc}
%\usepackage{tikz,pgf} %Pgfplots loads TikZ, and TikZ loads PGF by default


\usepackage{pgfplots}
%================================  You don't need all this for the MWE
\usepackage{slashbox}
\usepackage{bchart}


\usetikzlibrary{calc,trees,positioning,arrows,chains,shapes.geometric,%
    decorations.pathreplacing,decorations.pathmorphing,shapes,%
    matrix,shapes.symbols,automata}
%%=================================
\begin{document}

\begin{figure}[H]
\begin{tikzpicture}
\begin{axis}[%
scaled y ticks = true,
width=\textwidth,
height=8cm,
xlabel={Query},
ylabel={Elapsed Time (in seconds)},
grid=both,
ticks=both,
minor xtick={0,0.1,...,2},
enlarge x limits=0,
scaled x ticks = true
]
\addplot [
color=red,
solid,
line width=1.0pt
]
coordinates{
(0,10)
(1,4)
(2,5)
};
\end{axis}
\end{tikzpicture}
\caption{Blah}
\end{figure}

\end{document}
