


TIKZ フローチャートを簡単に記述するための npm パッケージを作成しました。Flowtex はフローチャートのメンテナンスを容易にします。たとえば、新しいノードの挿入や、他の機能としてのノードの配置などです。私にとってだけでなく、皆さんにとっても役立つことを願っています。
https://www.npmjs.com/package/flowtex
github で flowtex.sty を使用するに基づくTikZ でフローチャートを作成する
フローチャート
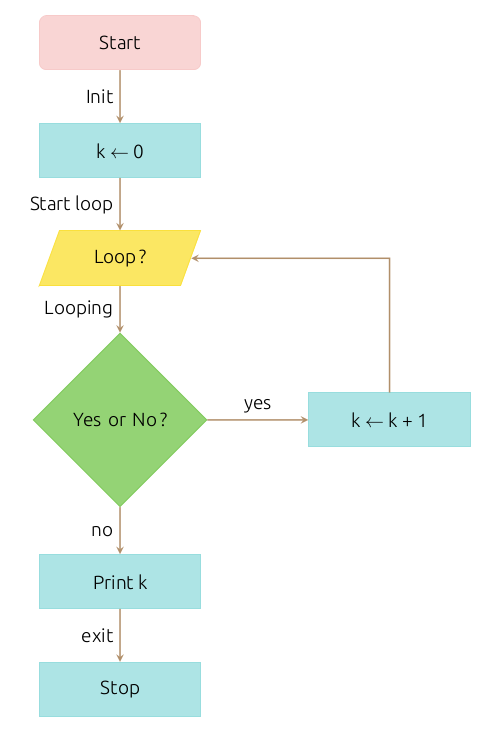
フローテックスコード
flowchart.offsetX("3");
  N('Start').belowGoto(
    P('k <- 0').belowGoto(
      loop = IO('Loop ?').belowGoto(
        D('Yes or No ?').offsetY(-1) // use offsetY with D
         .rightGoto(kp1 = P('k <- k + 1')).topLabel('yes')
         .belowGoto( // use offsetY for this node because is immediatly below of D
          P('Print k').offsetY(-1).belowGoto(
            P('Stop')
          ).leftLabel('exit')
        ).leftLabel('no')
      ).leftLabel('Looping')
    ).leftLabel('Start loop')
  ).leftLabel('Init');
  kp1.goto(loop).brokenArrow();
TIKZ を使用した LaTeX コード
\begin{center}
  \begin{tikzpicture}[node distance=2cm]
    \node (node0) [startstop] {Start};
    \node (node1) [process, below of=node0] {k $\leftarrow$ 0};
    \node (node2) [io, below of=node1] {Loop ?};
    \node (node3) [decision, below of=node2, yshift=-1cm] {Yes or No ?};
    \node (node4) [process, right of=node3, xshift=3cm] {k $\leftarrow$ k + 1};
    \node (node5) [process, below of=node3, yshift=-1cm] {Print k};
    \node (node6) [process, below of=node5] {Stop};
    \draw [arrow] (node3) --node[anchor=south] {yes} (node4);
    \draw [arrow] (node3) --node[anchor=east] {no} (node5);
    \draw [arrow] (node5) --node[anchor=east] {exit} (node6);
    \draw [arrow] (node2) --node[anchor=east] {Looping} (node3);
    \draw [arrow] (node1) --node[anchor=east] {Start loop} (node2);
    \draw [arrow] (node0) --node[anchor=east] {Init} (node1);
    \draw [arrow] (node4) |- (node2);
  \end{tikzpicture}
\end{center}
現在、生成された LaTeX コードを挿入するために \input を使用しています。しかし、次のような LaTeX コマンドを作成したいと思います。
\begin{flowtex}
Here, the Flowtex code.
\end{flowtex}
やり方はわかりますか?
答え1
@A.Ellet の回答の代替案 (どちらも質問の最初のバージョンを考慮しています):
 \documentclass[border=3mm,
                tikz]{standalone}
\usetikzlibrary{arrows.meta,
                calc, chains,
                quotes,
                positioning,
                shapes.geometric}

\begin{document}
  \begin{tikzpicture}[
    node distance = 8mm and 16mm,
      start chain = A going below,
      base/.style = {draw, minimum width=32mm, minimum height=8mm,
                     align=center, on chain=A},
 startstop/.style = {base, rounded corners, fill=red!30},
   process/.style = {base, fill=orange!30},
        io/.style = {base, trapezium,
                     trapezium left angle=70, trapezium right angle=110,
                     fill=blue!30},
  decision/.style = {base, diamond, fill=green!30},
  every edge quotes/.style = {auto=right}]
                    ]
\node [startstop]       {Start};            % <-- A-1
\node [process]         {k $\gets$ 0};
\node [io]              {Loop ?};
\node [decision]        {Yes or No ?};
\node [process]         {Print k};
\node [process]         {Stop};             % <-- A-6
%
\node [process,                             % <-- A-7
       right=of A-4]    {k $\gets$ k + 1};
%%
\draw [arrows=-Stealth]
    (A-1) edge["init"]          (A-2)
    (A-2) edge["start stop"]    (A-3)
    (A-3) edge["looping"]       (A-4)
    (A-4) edge["no"]            (A-5)
    (A-5) edge["exit"]          (A-6)
    (A-4) edge["yes"']          (A-7)       % <-- by ' is swapped label position
    (A-7) |- ($(A-2.south east)!0.5!(A-3.north east)$)
          -| ([xshift=7mm] A-3.north);
  \end{tikzpicture}
\end{document}
両方のソリューションを比較すると、次の主な違いがわかります。
- メインブランチのノードはチェーンとして設定されます(これによりコードが大幅に簡素化されます)
- ノード名はチェーンによって定義された名前が使用される
- ノードの共通パラメータには、新しいスタイルが定義されています
base - ノード間のエッジを描画するために、
quotesエッジ ラベルを書き込む構文を使用するパッケージが使用され、必要なコードが大幅に短縮されます。
上記の MWE (Minimal Working Example) をコンパイルすると、@A.Ellett の回答に示されているものと同様の図が生成されますが、重要な違いがあります。フィードバック エッジがより正確に描画されます (私の意見による)。

答え2
あなたのMWEには、どのライブラリを使用しているかなど、かなり多くの情報が欠けています。しかし、私はここで何もしていません。あなたのコードをコピーし、残りを盗用しました。このウェブページ。
色を除いて、次のコードで必要な処理が実行されるはずです。
\documentclass[border=4pt]{standalone}
\usepackage{tikz}
\usetikzlibrary{calc}
\usetikzlibrary{shapes.geometric}
\usetikzlibrary{arrows.meta}
\begin{document}

  \begin{tikzpicture}[
    node distance=2cm,
    startstop/.style={rectangle, rounded corners, minimum width=3cm, minimum height=1cm,text centered, draw=black, fill=red!30},
    process/.style={rectangle, minimum width=3cm, minimum height=1cm, text centered, draw=black, fill=orange!30},
    io/.style={trapezium, trapezium left angle=70, trapezium right angle=110, minimum width=3cm, minimum height=1cm, text centered, draw=black, fill=blue!30},
    decision/.style={diamond, minimum width=3cm, minimum height=1cm, text centered, draw=black, fill=green!30},
    ]

    \node (node0) [startstop]                             {Start};
    \node (node1) [process, below of=node0]               {k $\leftarrow$ 0};
    \node (node2) [io, below of=node1]                    {Loop ?};
    \node (node3) [decision, below of=node2, yshift=-1cm] {Yes or No ?};
    \node (node4) [process, right of=node3, xshift=3cm]   {k $\leftarrow$ k + 1};
    \node (node5) [process, below of=node3, yshift=-1cm]  {Print k};
    \node (node6) [process, below of=node5]               {Stop};

    \draw [arrows=-Stealth] (node3) --node[anchor=south]            {yes}        (node4);
    \draw [arrows=-Stealth] (node3) --node[anchor=east]             {no}         (node5);
    \draw [arrows=-Stealth] (node5) --node[anchor=east]             {exit}       (node6);
    \draw [arrows=-Stealth] (node2) --node[anchor=east]             {Looping}    (node3);
    \draw [arrows=-Stealth] (node1) --node[anchor=east]             {Start loop} (node2);
    \draw [arrows=-Stealth] (node0) --node[anchor=east]             {Init}       (node1);
    \draw [arrows=-Stealth] (node4) -- (node2);

  \end{tikzpicture}

\end{document}

残りの部分を微調整して、希望する色にするのはあなたにお任せします (結局のところ、私は色弱です)。