


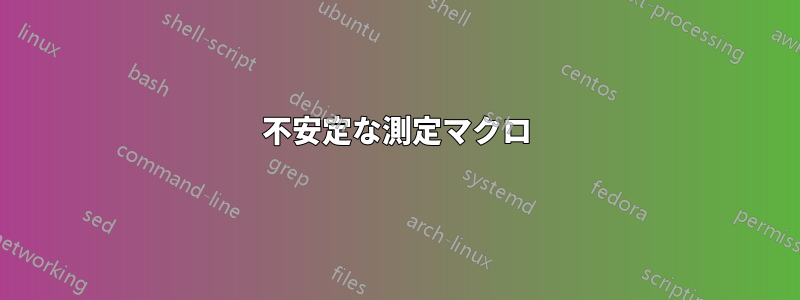
図面に測定値を追加できるマクロを作成しました\measurement。うまく機能しますが、ラベルが不安定になることがあります。以下の例では、コマンドは実質的に同じであるにもかかわらず、測定値ラベルが異なって回転しています。ラベル付けを制御するには、もっと良い方法があるはずです。誰かアイデアをお持ちですか?
\documentclass{standalone}
\usepackage{tikz}
\usetikzlibrary{calc}

\tikzset{myscale/.code={\edef\myscale{#1}\tikzset{scale=#1}}}
\def\myscale{1}

\newcommand{\measure}[4]{%
\pgfmathsetlengthmacro\mylength{8pt/\myscale}
\draw[very thin] #1 -- ($#1!\mylength!-90:#2$) coordinate (a) -- ($#1!\mylength+0.4*\mylength!-90:#2$);
\draw[very thin] #2 -- ($#2!\mylength!90:#1$) coordinate (b) -- ($#2!\mylength+0.4*\mylength!90:#1$);
\draw[very thin,<->,>=stealth] (a) -- (b) node[auto,sloped,#3] {#4};
}

\begin{document}

\begin{tikzpicture}[myscale=0.12]
\begin{scope}[rotate=20]

\draw[red] (0,0) -- (0,12);
\measure{(0,0)}{(0,12)}{midway,above,rotate=20,font=\small}{red}

\draw[blue] (0,12) -- (0,24);
\measure{(0,12)}{(0,24)}{midway,above,rotate=20,font=\small}{blue}

\end{scope}
\end{tikzpicture}

\end{document}

答え1
垂直線(丸めを除く)があり、それを 20 度回転させます。丸めに応じて、線は少し左または少し右に傾き、ノードは自然に反転します。
あなたが何をしようとしているのか、あるいはそれをどのように行うのが最善なのかについては、調査しようとはしていません。おそらく別の質問でしょう。
答えは次のようになります:垂直にすると不安定になる。
効果を確認するには、次のコードを試してください。
\documentclass[tikz, border=1cm]{standalone}
\tikzset{
nodetest/.pic={
\coordinate (c) at (1,10); %intermediate coordinate to create rounding
\draw (1,0) -- (c) node[auto, sloped, midway] {test};
}}
\begin{document}
\begin{tikzpicture}
\foreach \pos in {0.01,0.02,...,2}
\pic[scale=\pos] at (10*\pos,0) {nodetest};
\end{tikzpicture}
\end{document}
(0,0)から(1,10)までのスケール線:

(2,0)から(1,10)までのスケール線:

(1,0)から(1,10)までのスケール線:

中央の暗い帯状のノードは垂直線に対して不安定であることがわかります。
編集:
あなたが何を望んでいるのか推測することしかできません。以下は、最初の座標から 2 番目の座標まで読み取った線と平行でその下にあるノードを示しています。すべてのスケールで安定しています。
\documentclass[tikz, border=1cm]{standalone}
\usetikzlibrary{arrows.meta}
\begin{document}
\begin{tikzpicture}
\foreach \ang in {0,20,...,340}{
\coordinate (a) at (\ang:1);
\coordinate (b) at (\ang:4);
\draw[Stealth-Stealth] (a) --node[sloped, auto, swap, allow upside down=true]{red} (b);
}
\end{tikzpicture}
\end{document}

答え2
おそらくこれが役に立つでしょう -tkz-euclide

ムウェ
\documentclass{article}
\usepackage{tkz-euclide}
\begin{document}


\begin{tikzpicture}[scale=1.2]
    \tkzDefPoints{0/0/A,-4/4/B}
    \tkzDefPointWith[linear,K=0.5](A,B)
    \tkzGetPoint{C}

    \tkzDrawSegment[red, very thick](A,C)
    \tkzDrawSegment[blue,very thick](B,C)
    \tkzDrawPoints[color=black](A,B,C)
    \tkzLabelPoints[above right=3pt](A,B,C)
    \tkzDrawSegment[style=red, dashed, dim={$10$,15pt,midway,font=\scriptsize, rotate=45}](A,C)
    \tkzDrawSegment[style=blue, dashed, dim={$10$,15pt,midway,font=\scriptsize, rotate=45}](C,B)
\end{tikzpicture}
\end{document}