


\begin{center}
\begin{asy}
    unitsize(5cm);
draw(unitcircle, dashed);
    pair A1 = dir(70);
    pair A2 = dir(50);
    pair A3 = dir(10);
    pair A4 = dir(-30);
    pair A5 = dir(-60);
    pair A6 = dir(260);
    pair A7 = dir(240);
    pair A8 = dir(210);
    pair A9 = dir(135);
    label("$1$", A1, dir(A1));
    label("$2$", A2, dir(A2));
    label("$3$", A3, dir(A3));
    label("$4$", A4, dir(A4));
    label("$5$", A5, dir(A5));
    label("$6$", A6, dir(A6));
    label("$7$", A7, dir(A7));
    label("$8$", A8, dir(A8));
    label("$9$", A9, dir(A9));
    pair A = 0.3*dir(50) + 0.4*dir(80);
    pair B = 0.3*dir(50) + 0.4*dir(130);
    pair C = 0.3*dir(50) + 0.4*dir(230);
    pair D = 0.3*dir(50) + 0.4*dir(330);
    pair E = 0.3*dir(50) + 0.4*dir(20);
    \draw(A--B--C--D--E--cycle);
    \draw(A1--A--A2);
    \draw(E--A3);
    \draw(D--A4);
    pair X = B + 0.4 * dir(180);
    pair Y = C + 0.4 * dir(180);
    pair Z = Y + 0.4 * dir(245);
    pair W = D + 0.6 * dir(225);
    draw(X--A9);
    draw(Y--Z--A8);
    draw(Z--A7);
    draw(A6--W--D);
    draw(W--A5);
    draw(B--X--Y--C--W);

    dotfactor *= 2;
    dot(A, mediumgrey);
    dot(B, mediumgrey);
    dot(C, black);
    dot(D, mediumgrey);
    dot(E, black);
    dot(X, black);
    dot(Y, mediumgrey);
    dot(Z, mediumgrey);
    dot(W, black);

\end{asy}
\end{center}

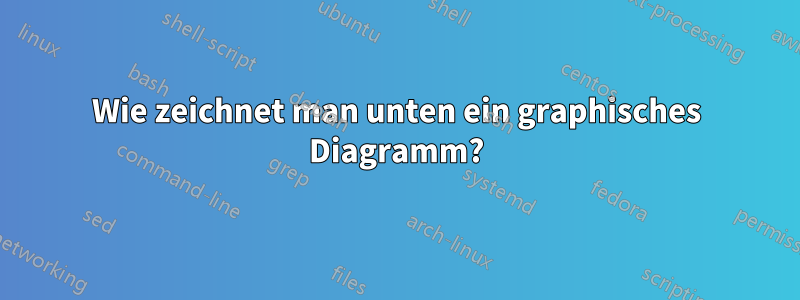
Dies ist das Bild von Evan Chen aus seinen Vorlesungsnotizen.
Antwort1
Ich bin besser vertraut mit tikz, hier ist eine Lösung mit tikz. Einige Koordinaten sind möglicherweise nicht präzise, aber der Code sollte ziemlich unkompliziert sein. Daher ist es sehr einfach, die Knoten zu ändern.
Ergebnis

Benennung von Knoten

\documentclass{standalone}
\usepackage[T1]{fontenc}
\usepackage{expl3}
\usepackage{tikz}

\tikzset{
    plainnode/.style={
        inner sep=0pt, outer sep=0pt
    },
    graydot/.style={
        circle, fill=gray!50, minimum size=3pt, plainnode
    },
    blackdot/.style={
        circle, fill=black, minimum size=3pt, plainnode
    }
}

\ExplSyntaxOn

% set the radius of circle
\fp_new:N \l_circle_radius_fp
\fp_set:Nn \l_circle_radius_fp {2.1}
% set how much the text on the circle shifts
\fp_new:N \l_text_shift_fp
\fp_set:Nn \l_text_shift_fp {0.06}

\newcommand*{\drawcircle}{
    \node[dashed, draw, circle, inner~sep=0pt, minimum~size=\fp_eval:n{2.0 * \l_circle_radius_fp}cm] at (0, 0) {};
}

% create a new point at given location
\newcommand*{\newpoint}[4]{
    \node[#3] (#4) at (#1 cm, #2 cm) {};
}

% create a new point on the circle
\newcommand*{\newcircpoint}[3]{
    \fp_set:Nn \l_tmpa_fp {\l_circle_radius_fp*cos(#1 * \c_one_degree_fp)}
    \fp_set:Nn \l_tmpb_fp {\l_circle_radius_fp*sin(#1 * \c_one_degree_fp)}

    % anchor node for connecting lines
    \node[plainnode] (#2) at (\fp_use:N \l_tmpa_fp cm,\fp_use:N \l_tmpb_fp cm) {};

    % text node for displaying number
    \node[plainnode] at (
        \fp_eval:n {(1.0 + \l_text_shift_fp) * \l_tmpa_fp} cm,
        \fp_eval:n {(1.0 + \l_text_shift_fp) * \l_tmpb_fp} cm) {\tiny #3};
}

% draw lines between nodes
\newcommand*{\drawline}[1]{
    \clist_set:Nn \l_tmpa_clist {#1}
    \clist_map_variable:NNn \l_tmpa_clist \l_tmpa_tl {
        \draw (\tl_item:Nn \l_tmpa_tl {1})--(\tl_item:Nn \l_tmpa_tl {2});
    }
}

\ExplSyntaxOff

\begin{document}

\begin{tikzpicture}

\drawcircle

\newpoint{-0.9}{1.2}{blackdot}{A}
\newpoint{-0.1}{1.2}{graydot}{B}
\newpoint{0.6}{1.4}{graydot}{C}
\newpoint{-0.9}{-0.1}{graydot}{D}
\newpoint{-0.1}{-0.1}{blackdot}{E}
\newpoint{1.2}{0.7}{blackdot}{F}
\newpoint{-1.2}{-1.0}{graydot}{G}
\newpoint{0.2}{-0.8}{blackdot}{H}
\newpoint{1.0}{0.0}{graydot}{I}

\newcircpoint{70}{J}{1}
\newcircpoint{55}{K}{2}
\newcircpoint{8}{L}{3}
\newcircpoint{-20}{M}{4}
\newcircpoint{-60}{N}{5}
\newcircpoint{-100}{O}{6}
\newcircpoint{-120}{P}{7}
\newcircpoint{-145}{Q}{8}
\newcircpoint{120}{R}{9}

\drawline{AB, AD, AR, BC, BE, CJ, CK, CF, DE, DG, EI, EH, FI, FL,
    GQ, GP, HO, HN, HI, IM}

\end{tikzpicture}

\end{document}