


Estoy intentando que una imagen de un gráfico de función y un entorno tabular se vea algo decente y tengo problemas. Aquí está el fragmento de código.
\documentclass{article}
\usepackage{graphicx}
\begin{document}
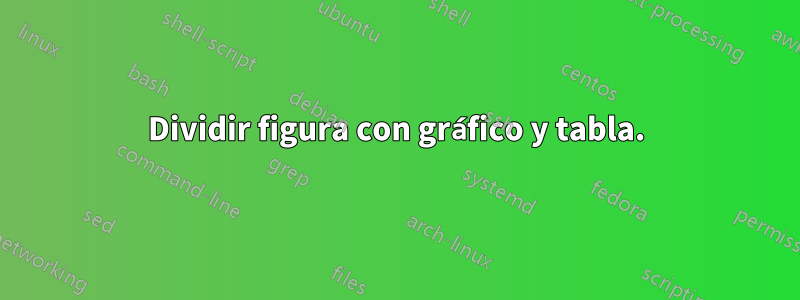
(a) On the left is the Cartesian plot of the function $y = 2 + 2 \cos (x)$ with
$0 \le x \le 2 \pi$. Using it, fill in the table, following the format
established in the first row.
\includegraphics[scale=0.5]{cosine-2}
\begin{tabular}{l|l}
Range & Behavior of $2 + 2 \cos \theta$ \\
\hline
$\left( 0, \frac \pi 2 \right)$ & Decreasing from 4 to 2 \\
\hline
$\left(\frac \pi 2, \pi \right)$ & \\
\hline
$\left(\pi, \frac{3\pi}{2} \right)$ & \\
\hline
$\left(\frac{3\pi}{2}, 2\pi \right)$ &
\end{tabular}
\end{document}
Adjunto una captura de pantalla del resultado PDF de este fragmento de código.Producción1
No entiendo por qué la imagen y la tabla están desplazadas como están. Dado que la tabla y la imagen tienen aproximadamente la misma altura, me gustaría organizarlas para dejar menos espacio en blanco. ¿Cómo puedo hacer eso?
Intenté solucionarlo brevemente usando subfiguras, pero no tuve éxito.
Respuesta1
Aquí hay dos sugerencias diferentes sobre cómo centrar verticalmente la imagen y la tabla entre sí:
\documentclass[addpoints,12pt,answers]{exam}
\usepackage{graphicx}

\usepackage[export]{adjustbox}

\begin{document}

(a) On the left is the Cartesian plot of the function $y = 2 + 2 \cos (x)$ with
$0 \le x \le 2 \pi$. Using it, fill in the table, following the format
established in the first row.

\includegraphics[scale=0.5,valign=c]{example-image}
\begin{tabular}{l|l}
        Range & Behavior of $2 + 2 \cos \theta$ \\
        \hline
        $\left( 0, \frac \pi 2 \right)$ & Decreasing from 2 to 0 \\
        \hline
        $\left(\frac \pi 2, \pi \right)$ & \\
        \hline
        $\left(\pi, \frac{3\pi}{2} \right)$ & \\
        \hline
        $\left(\frac{3\pi}{2}, 2\pi \right)$ &\\
\end{tabular}

\bigskip

(a) On the left is the Cartesian plot of the function $y = 2 + 2 \cos (x)$ with
$0 \le x \le 2 \pi$. Using it, fill in the table, following the format
established in the first row.

\begin{minipage}{0.475\textwidth}
\centering
\includegraphics[scale=0.5,valign=t]{example-image}
\end{minipage}
\hfill
\begin{minipage}{0.475\textwidth}
\centering
\renewcommand{\arraystretch}{1.5}
\begin{tabular}{l|l}
        Range & Behavior of $2 + 2 \cos \theta$ \\
        \hline
        $\left( 0, \frac{\pi}{2} \right)$ & Decreasing from 2 to 0 \\
        \hline
        $\left(\frac{\pi}{2}, \pi \right)$ & \\
        \hline
        $\left(\pi, \frac{3\pi}{2} \right)$ & \\
        \hline
        $\left(\frac{3\pi}{2}, 2\pi \right)$ &\\
\end{tabular}
\end{minipage}
\end{document}
Si desea alinear la imagen y la tabla en la parte superior, puede usar
\includegraphics[scale=0.5,valign=t]{example-image}
\begin{tabular}[t]{l|l}
Como nota al margen: en lugar de numerar manualmente las subpreguntas, es posible que desee utilizar el \partsmecanismo de la examclase como se muestra a continuación:
\documentclass[addpoints,12pt,answers]{exam}
\usepackage{graphicx}

\usepackage[export]{adjustbox}

\begin{document}

\begin{questions}
\question
This is the question text
\begin{parts}
\part On the left is the Cartesian plot of the function $y = 2 + 2 \cos (x)$ with
$0 \le x \le 2 \pi$. Using it, fill in the table, following the format
established in the first row.

\begin{minipage}{0.475\textwidth}
\centering
\includegraphics[scale=0.5,valign=t]{example-image}
\end{minipage}
\hfill
\begin{minipage}{0.475\textwidth}
\centering
\renewcommand{\arraystretch}{1.5}
\begin{tabular}{l|l}
        Range & Behavior of $2 + 2 \cos \theta$ \\
        \hline
        $\left( 0, \frac{\pi}{2} \right)$ & Decreasing from 2 to 0 \\
        \hline
        $\left(\frac{\pi}{2}, \pi \right)$ & \\
        \hline
        $\left(\pi, \frac{3\pi}{2} \right)$ & \\
        \hline
        $\left(\frac{3\pi}{2}, 2\pi \right)$ &\\
\end{tabular}
\end{minipage}
\end{parts}
\end{questions}
\end{document}