


Estoy intentando trazar tres columnas de una tabla con pgfplot.
He estado mirando a mi alrededor pero las soluciones que he encontrado parecen no funcionar para mí. Hasta ahora no importa lo que haga, solo aparece una línea con ticks (que no quiero).
He comprobado (por nombrar algunos lugares)
- Utilice varias columnas como eje y para un gráfico pgfplots
- Trazar múltiples valores de una columna de una tabla con PGFPLOTS
Este es el código actual:
\begin{figure}
  \centering
  \begin{tikzpicture}
  \begin{axis}[
  title=My first gaph,
  xlabel={$\text{Ár}$},
  ylabel={$\text{Skerðingar}$},
  ]
  \addplot+[] table {test.txt};
  \foreach \column in {1,...,3}{
  \addplot+[] table {test.txt};}
  \end{axis}
  \end{tikzpicture}
  \end{figure}
yo también lo he probado
\begin{figure}
  \centering
  \begin{tikzpicture}
  \begin{axis}[
  title=My first gaph,
  xlabel={$\text{Ár}$},
  ylabel={$\text{Skerðingar}$},
  ]
  \addplot+[blue] table[meta=Steady] {test.txt};
  \addplot+[red] table[meta=Incr] {test.txt};
  \end{axis}
  \end{tikzpicture}
  \end{figure}
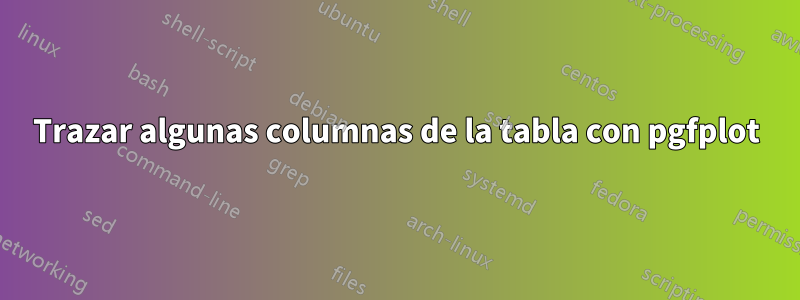
Hasta ahora solo puedo hacer esta foto.

Pero estoy intentando hacer algo similar a esto.

Estoy bastante seguro de que podré arreglar los años y poner las leyendas correspondientes para cada línea. Cambié los nombres de cada columna a inglés para evitar errores con caracteres especiales en mi idioma.
Finalmente, la tabla que me encantaría trazar.
Year    Steady  Incr    Random
2021    280.00  280.00  280.00
2022    289.56  284.20  333.32
2023    293.72  288.46  200.60
2024    296.16  292.79  103.47
2025    297.63  297.18  402.42
2026    298.64  301.64  387.03
2027    300.05  306.16  457.79
2028    301.38  310.76  307.06
2029    303.17  315.42  146.29
2030    305.04  320.15  245.75
2031    306.32  324.95  279.80
2032    307.75  329.83  142.60
2033    309.13  334.77  304.65
2034    310.46  339.79  267.77
2035    311.72  344.89  160.39
2036    312.95  350.06  513.19
2037    314.13  355.32  261.99
2038    315.25  360.65  253.23
2039    316.35  366.06  505.29
2040    317.86  371.55  527.03
2041    318.95  377.12  367.09
2042    320.04  382.78  137.13
2043    321.14  388.52  225.11
2044    322.28  394.35  233.99
2045    323.46  400.26  186.64
2046    324.67  406.26  531.08
2047    325.91  412.36  418.04
2048    327.17  418.54  475.53
2049    328.44  424.82  318.89
2050    329.74  431.19  495.73
2051    331.11  437.66  306.65
2052    332.48  444.23  265.86
2053    333.84  450.89  253.02
2054    335.18  457.65  164.01
2055    336.52  464.52  263.51
2056    337.83  471.49  453.54
2057    339.12  478.56  478.29
2058    340.38  485.74  391.17
2059    341.60  493.02  429.69
2060    342.79  500.42  487.88
2061    345.10  507.93  373.95
2062    346.45  515.54  540.48
2063    347.80  523.28  217.49
2064    349.14  531.13  167.71
2065    350.49  539.09  373.09
2066    351.84  547.18  353.81
2067    353.18  555.39  354.63
2068    354.53  563.72  185.00
2069    355.88  572.17  426.76
2070    357.22  580.76  206.34
Estoy bastante seguro de que mi tesis irá más rápido si domino pgfplot (me enteré ayer, así que tenga paciencia). La documentación no me está ayudando mucho, pero tal vez la estoy entendiendo mal.
Esta es una tesis por lo que hay bastantes paquetes, pero aquí está:
\documentclass[a4paper,12pt,twoside,BCOR=10mm]{scrbook}

% Packages
\usepackage[utf8]{inputenc}
\usepackage[icelandic]{babel}
\usepackage{t1enc}
\usepackage{graphicx}
\usepackage[intoc]{nomencl}
\usepackage{enumerate,color}
\usepackage{url}
\usepackage[pdfborder={0 0 0}]{hyperref}
\BeforeTOCHead[toc]{\cleardoublepage\pdfbookmark{\contentsname}{toc}} % Add Table of Contents to PDF "bookmark" table of contents
\usepackage{appendix}
\usepackage{eso-pic}
\usepackage{amsmath}
\usepackage{amssymb}
\usepackage{longtable}
\usepackage[sf,normalsize]{subfigure}
\usepackage[format=plain,labelformat=simple,labelsep=colon]{caption}
\usepackage{placeins}
\usepackage{tabularx}
\usepackage{multirow}
\usepackage{subfigure}
% Packages used for title page layout
\usepackage{xcolor}
\usepackage{tikz}
\usetikzlibrary{positioning}
\usepackage{pgfplots}
\pgfplotsset{compat=newest}
\usepgfplotslibrary{external}

% Blue color according to HÍ corporate design
\convertcolorspec{RGB}{16,9,159}{rgb}\tmphiblue
\definecolor{hiblue}{rgb}\tmphiblue


\setlength{\parskip}{\baselineskip}
\setlength{\parindent}{0cm}
\raggedbottom

\setkomafont{captionlabel}{\itshape}
\setkomafont{caption}{\itshape}
\setkomafont{section}{\FloatBarrier\Large}
\setcapwidth{\textwidth}
%\setcapwidth[l]{\textwidth} % The original template had the [l] which leads to a warning that it gets ignored, so to reduce warnings, removed it.
\setcapindent{1em}


\usepackage{lmodern} % Use Latin Modern (instead of the default Computer Modern that is rendered using a bitmap font).
\usepackage{fixcmex} % To fix that Latin Modern large symbol math fonts has by default only one size: https://tex.stackexchange.com/a/621536
% Times new roman font instead of the standard LaTeX fonts: has not been test -- try this on your own risk
\usepackage[T1]{fontenc}
\usepackage{mathptmx}


%%%%%%%%%%%%%%%%% Configurations (Useful defaults, but OK to change %%%%%%%%%%%%%%%%%%%
\graphicspath{{figs/}} % Figures in directory figs

% Bibliography

% \usepackage[authoryear]{natbib} % Uncoment if you want to used NatBib instead of BibLaTeX (and comment the bitlatex line below)

\usepackage[backend=biber, style=authoryear]{biblatex}  % BibLaTeX used for references.
\usepackage{csquotes} % BibLaTex wants to have context sensitive quotes
\addbibresource{references.bib} %  Name of *.bib file containing references
Respuesta1
\documentclass[{article}

\usepackage[dvipsnames]{xcolor}

\usepackage{pgfplots}
\pgfplotsset{compat=newest}

\begin{document}

\begin{tikzpicture}
\pgfkeys{/pgf/number format/.cd,1000 sep={ }} % to remove the thousand separator
\begin{axis}[
title=Title,
xlabel={x label},
ylabel={y label},
legend columns=-1, % to set one line legend
legend style={at={(0.5,-0.3)},anchor=center},
ymajorgrids
 ]
 \addplot[blue, thick] table [x=Year, y=Steady, col sep=space] {data.txt};
 \addplot[red, thick] table [x=Year, y=Incr, col sep=space] {data.txt};
 \addplot[Goldenrod, thick] table [x=Year, y=Random, col sep=space] {data.txt};
 \legend{Steady, Incr, Random}
 \end{axis}
\end{tikzpicture}

\end{document}
Utilicé el color 'Goldenrod' que es mejor que el amarillo, si quieres usarlo recuerda cargar el paquete xcolorcon la opción [dvipsnames]antes de pgfplotso tendrás un error.
