


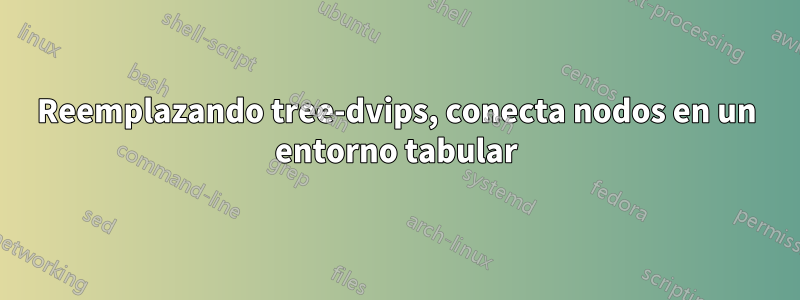
Quiero deshacerme de tree-dvips ya que no es compatible con xelatex y ps-tricks ya que no se compila eficientemente con xelatex. Tengo las siguientes figuras:


Fueron compuestos utilizando tabularpara la disposición de los nodos. Luego usé tree-dvips(y más tarde ps-tricks) conectar los identificadores (h0, h7, ...) al término que dominan los identificadores. Las líneas comienzan debajo del asa y terminan al norte del nodo dominado, en el medio del nodo dominado.
Ahora tengo una solución usando tikzmark, pero la desventaja parece ser que uno tiene que cambiar las posiciones de los elementos marcados a mano, es decir, las líneas no terminan en el norte/medio y no comienzan en el sur/medio.
\documentclass{article}


\usepackage{tikz}

\usetikzlibrary{tikzmark} % saves positions in tikz pictures, allows to connect arbitrary text
\usetikzlibrary{calc}

\begin{document}

  \begin{figure}
  \centering

  \begin{tabular}{@{}ccc@{}}
                           & \tikzmark{h0}{h0}                & \\[4ex]
  \tikzmark{h8}{h8:wieder(\tikzmark{h8h9}{h9})}\\[4ex]
  \tikzmark{h1}{h1:every(x, \tikzmark{h1h2}{h2}, \tikzmark{h1h3}{h3})}      &                              & \tikzmark{h6}{h6:CAUSE(max, \tikzmark{h6h7}{h7})}\\[8ex]
  \tikzmark{h4}{h4:window(x)}           &          & \\[6ex]
                           & \tikzmark{h5}{h5:open(x)}\\
  \end{tabular}
\begin{tikzpicture}[overlay,remember picture]
\draw[dashed] ($(pic cs:h0)+(3ex,2.5ex)$) to($(pic cs:h8)+(1ex,2ex)$);
\draw[dashed] ($(pic cs:h0)+(3ex,2.5ex)$) to($(pic cs:h6)+(1ex,2ex)$);
\draw[dashed] ($(pic cs:h8h9)+(3ex,2.5ex)$) to($(pic cs:h1)+(1ex,2ex)$);
\draw[dashed] ($(pic cs:h6h7)+(3ex,2.5ex)$) to($(pic cs:h5)+(1ex,2ex)$);
\draw[dashed] ($(pic cs:h1h2)+(3ex,2.5ex)$) to($(pic cs:h4)+(1ex,2ex)$);
\draw[dashed] ($(pic cs:h1h3)+(3ex,2.5ex)$) to($(pic cs:h5)+(1ex,2ex)$);
\end{tikzpicture}

\end{figure}

\end{document}
(El cambio no se realiza correctamente en mi MWE ya que creo que no es necesario en la solución real). Intenté poner un entorno tabular en tikzpicture o usarlo \subnodeen un entorno tabular, pero ninguno de estos intentos funcionó.
Editar:Probé la solución a continuación, pero obtuve:
! Package pgfkeys Error: I do not know the key '/tcb/empty' and I am going to i
gnore it. Perhaps you misspelled it.

See the pgfkeys package documentation for explanation.
Type  H <return>  for immediate help.
...

 l.15   & \mybox[h0]{h0}
                                          & \\[4ex]
 ?
¿Hay algo en tcb que requiera texlive 2014 en lugar de 2013?
Respuesta1
Puede utilizar tcolorboxpara construir cajas invisibles alrededor de las piezas que desea conectar que proporcionarán anclajes (como south, northetc.), para evitar cálculos manuales.
\documentclass{article}


\usepackage{tcolorbox}
\tcbuselibrary{skins}
\newtcbox{\mybox}[1][]{empty,shrink tight,nobeforeafter,on line,before upper=\vphantom{gM},remember as=#1}

\begin{document}

  \begin{figure}
  \centering

  \begin{tabular}{@{}ccc@{}}
  & \mybox[h0]{h0}                       & \\[4ex]
    \mybox[h8]{h8:wieder}\mybox[h9]{(h9)}  \\[4ex]
    \mybox[h1]{h1:every(x, \mybox[h2]{h2}, \mybox[h3]{h3})}      &                              & \mybox[h6]{h6:CAUSE(max, \mybox[h7]{h7})}\\[8ex]
  \mybox[h4]{h4:window(x)}           &          & \\[6ex]
                           & \mybox[h5]{h5:open(x)}\\
  \end{tabular}


\begin{tikzpicture}[overlay,remember picture,draw=gray,dashed,shorten <=2pt,shorten >=2pt]
\draw(h0.south)--(h8.north);
\draw(h0.south)--(h6.north);
\draw(h9.south)--(h1.north);
\draw(h2.south)--(h4.north);
\draw(h3.south)--(h5.north);
\draw(h7.south)--(h5.north);
\end{tikzpicture}

\end{figure}

\end{document}

Para estar completo, otro similar a la segunda imagen con:
\draw(h3.south) .. controls +(0,-1) and +(-1,1).. (h6.north);

Editar:Para resumir la discusión en los comentarios, el siguiente código no usa la emptyclave (no disponible en TeX Live 2013) y usa bottomy toppara agregar más espacio encima y debajo de los cuadros.
\documentclass{article}


\usepackage{tcolorbox}
\tcbuselibrary{skins}
\newtcbox{\mybox}[1][]{enhanced,boxrule=0pt,colframe=white,colback=white,shrink tight,nobeforeafter,on line,before upper=\vphantom{gM},remember as=#1,top=3pt,bottom=3pt}

\begin{document}

  \begin{figure}
  \centering

  \begin{tabular}{@{}ccc@{}}
  & \mybox[h0]{h0}                       & \\[4ex]
    \mybox[h8]{h8:wieder}\mybox[h9]{(h9)}  \\[4ex]
    \mybox[h1]{h1:every(x, \mybox[h2]{h2}, \mybox[h3]{h3})}      &                              & \mybox[h6]{h6:CAUSE(max, \mybox[h7]{h7})}\\[8ex]
  \mybox[h4]{h4:window(x)}           &          & \\[6ex]
                           & \mybox[h5]{h5:open(x)}\\
  \end{tabular}


\begin{tikzpicture}[overlay,remember picture,draw=gray,dashed,shorten <=2pt,shorten >=2pt]
\draw(h0.south)--(h8.north);
\draw(h0.south)--(h6.north);
\draw(h9.south)--(h1.north);
\draw(h2.south)--(h4.north);
\draw(h3.south)--(h5.north);
\draw(h7.south)--(h5.north);
\end{tikzpicture}

\end{figure}

\end{document}
Respuesta2
En lugar de utilizar el paquete tikzmark, puedes definir el tuyo propio \tikzmarkcomo un habitual node. No es necesario utilizar tcolorboxel paquete.
\documentclass{article}
\usepackage{tikz}

\newcommand{\tikzmark}[2]%
    {\tikz[baseline=(#1.base), remember picture]\node[outer sep=0pt, inner sep=0pt] (#1) {#2};}

\begin{document}

  \begin{figure}
  \centering

  \begin{tabular}{@{}ccc@{}}
                           & \tikzmark{h0}{h0}                & \\[4ex]
  \tikzmark{h8}{h8:wieder}\tikzmark{h8h9}{(h9)}\\[4ex]
  \tikzmark{h1}{h1:every}(x, \tikzmark{h1h2}{h2}, \tikzmark{h1h3}{h3})      &                              & \tikzmark{h6}{h6:CAUSE}(max, \tikzmark{h6h7}{h7})\\[8ex]
  \tikzmark{h4}{h4:window(x)}           &          & \\[6ex]
                           & \tikzmark{h5}{h5:open(x)}\\
  \end{tabular}
\begin{tikzpicture}[overlay,remember picture,draw=gray,dashed,shorten <=2pt,shorten >=2pt]
\draw(h0.south)--(h8.north);
\draw(h0.south)--(h6.north);
\draw(h8h9.south)--(h1.north);
\draw(h1h2.south)--(h4.north);
\draw(h1h3.south)--(h5.north);
\draw(h6h7.south)--(h5.north);
\end{tikzpicture}
\end{figure}

\end{document}
