


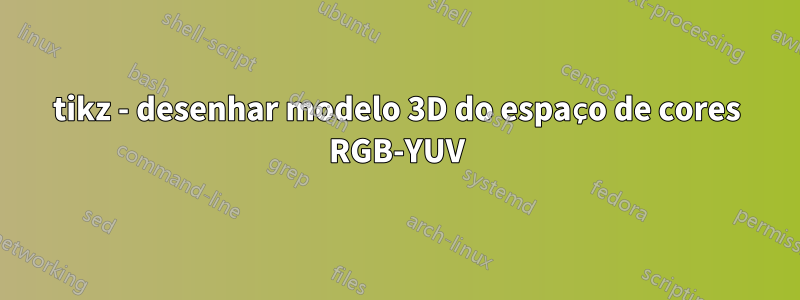
Desejo desenhar um modelo de espaço de cores 3D RGB-YUV. que se parece com abaixo:

O espaço de cores do cubo RGB (0,255), fórmula de conversão RGB para YUV é:

Fórmula YUV para RGB:

Desejo obter o gráfico exato conforme a fórmula indicada. Qual pacote talvez seja melhor para desenhar esse diagrama?
Responder1
Sim, pode-se ensinar TikZ para fazer transformações lineares. Sua captura de tela mostra uma projeção não ortográfica. Então adiciono essa projeção no final da resposta, embora pessoalmente não goste muito delas. Adicionei uma função RGBvecque faz a transformação linear (módulo typos porque não sou bom em digitar textos de um show de tela, principalmente quando não sei de onde vêm essas coisas) e adicionei um estilo rápido que transforma as coordenadas RGB para o outro esquema de cores. Todas essas coisas podem ser ajustadas, mas pelo menos isso mostra como se pode fazer isso em princípio.
\documentclass[tikz,border=3mm]{standalone}
\usepackage{tikz-3dplot}
\def\matCC{{0.257, 0.504, 0.098},%
        {-0.148, -0.291, 0.439},%
        {0.439, -0.368,0.071}}%
\pgfmathdeclarefunction{RGBvec}{3}{%
\begingroup%
\pgfmathsetmacro{\myY}{16+{\matCC}[0][0]*#1+{\matCC}[0][1]*#2+{\matCC}[0][2]*#3}%
\pgfmathsetmacro{\myCb}{128+{\matCC}[1][0]*#1+{\matCC}[1][1]*#2+{\matCC}[1][2]*#3}%
\pgfmathsetmacro{\myCr}{128+{\matCC}[2][0]*#1+{\matCC}[2][1]*#2+{\matCC}[2][2]*#3}%
\edef\pgfmathresult{\myCr,\myCb,\myY}%
\pgfmathsmuggle\pgfmathresult\endgroup%
}%

\begin{document}
\tdplotsetmaincoords{70}{110}
\begin{tikzpicture}[bullet/.style={circle,inner
    sep=2pt,fill},line cap=round,line join=round,
    RGB coordinate/.code args={(#1,#2,#3)}{\pgfmathparse{RGBvec(#1,#2,#3)}%
    \tikzset{insert path={(\pgfmathresult)}}},font=\sffamily,thick]
 \begin{scope}[tdplot_main_coords,scale=1/40]
  \draw[-stealth] (0,0,0) coordinate (O) -- (280,0,0) coordinate[label=below:Cr] (Cr);
  \draw[-stealth]  (O) -- (0,280,0) coordinate[label=below:Cb] (Cb);
  \draw[-stealth]  (O) -- (0,0,280) coordinate[label=left:Y] (Y);
  \path [RGB coordinate={(255,255,255)}] node[bullet,draw,fill=white] (white){}
    [RGB coordinate={(0,0,0)}] node[bullet] (black){}
    [RGB coordinate={(255,0,0)}] node[bullet,red] (red){}
    [RGB coordinate={(0,255,0)}] node[bullet,green] (green){}
    [RGB coordinate={(0,0,255)}] node[bullet,blue] (blue){}
    [RGB coordinate={(255,0,255)}] node[bullet,magenta] (magenta){}
    [RGB coordinate={(255,255,0)}] node[bullet,yellow] (yellow){}
    [RGB coordinate={(0,255,255)}] node[bullet,cyan] (cyan){};
   \draw (red) -- (black) -- (blue) -- (magenta) -- (red) -- (yellow)
   -- (green) edge (black) -- (cyan) edge (blue) -- (white)  edge (magenta) -- (yellow);
   \draw[thin] (255,0,0) node[left]{255} -- (255,255,0) -- (0,255,0) node[above]{255}
   (0,0,255) node[left]{255} -- (255,0,255) edge (255,0,0)
    -- (255,255,255)  edge (255,255,0) -- (0,255,255)  edge (0,255,0)
   -- cycle ;
 \end{scope}
 \begin{scope}[xshift=8cm,scale=1/40]
  \pgfmathdeclarefunction*{RGBvec}{3}{%
  \begingroup%
  \pgfmathsetmacro{\myY}{16+{\matCC}[0][0]*#1+{\matCC}[0][1]*#2+{\matCC}[0][2]*#3}%
  \pgfmathsetmacro{\myCb}{128+{\matCC}[1][0]*#1+{\matCC}[1][1]*#2+{\matCC}[1][2]*#3}%
  \pgfmathsetmacro{\myCr}{128+{\matCC}[2][0]*#1+{\matCC}[2][1]*#2+{\matCC}[2][2]*#3}%
  \edef\pgfmathresult{\myCb,\myY,\myCr}%
  \pgfmathsmuggle\pgfmathresult\endgroup%
  }%
  \draw[-stealth] (0,0,0) coordinate (O) -- (255,0,0) coordinate[label=below:Cb] (Cb);
  \draw[-stealth]  (O) -- (0,255,0) coordinate[label=left:Y] (Y);
  \draw[-stealth]  (O) -- (0,0,255) coordinate[label=below:Cr] (Cr);
  \path [RGB coordinate={(255,255,255)}] node[bullet,draw,fill=white] (white){}
    [RGB coordinate={(0,0,0)}] node[bullet] (black){}
    [RGB coordinate={(255,0,0)}] node[bullet,red] (red){}
    [RGB coordinate={(0,255,0)}] node[bullet,green] (green){}
    [RGB coordinate={(0,0,255)}] node[bullet,blue] (blue){}
    [RGB coordinate={(255,0,255)}] node[bullet,magenta] (magenta){}
    [RGB coordinate={(255,255,0)}] node[bullet,yellow] (yellow){}
    [RGB coordinate={(0,255,255)}] node[bullet,cyan] (cyan){};
   \draw (red) -- (black) -- (blue) -- (magenta) -- (red) -- (yellow)
   -- (green) edge (black) -- (cyan) edge (blue) -- (white)  edge (magenta) -- (yellow);
  \end{scope}
\end{tikzpicture}
\end{document}

As projeções ortográficas têm a vantagem de poder aplicar transformações ortogonais, ou seja, rotações, e o resultado é realista (até efeitos de perspectiva, que podem ser tratados usando a perspectivebiblioteca).
\documentclass[tikz,border=3mm]{standalone}
\usepackage{tikz-3dplot}
\def\matCC{{0.257, 0.504, 0.098},%
        {-0.148, -0.291, 0.439},%
        {0.439, -0.368,0.071}}%
\pgfmathdeclarefunction{RGBvec}{3}{%
\begingroup%
\pgfmathsetmacro{\myY}{16+{\matCC}[0][0]*#1+{\matCC}[0][1]*#2+{\matCC}[0][2]*#3}%
\pgfmathsetmacro{\myCb}{128+{\matCC}[1][0]*#1+{\matCC}[1][1]*#2+{\matCC}[1][2]*#3}%
\pgfmathsetmacro{\myCr}{128+{\matCC}[2][0]*#1+{\matCC}[2][1]*#2+{\matCC}[2][2]*#3}%
\edef\pgfmathresult{\myCr,\myCb,\myY}%
\pgfmathsmuggle\pgfmathresult\endgroup%
}%
\tikzset{RGB coordinate/.code args={(#1,#2,#3)}{\pgfmathparse{RGBvec(#1,#2,#3)}%
    \tikzset{insert path={(\pgfmathresult)}}}}
\begin{document}
\foreach \X in {0,10,...,350}
{\tdplotsetmaincoords{70}{\X}
\begin{tikzpicture}[bullet/.style={circle,inner
    sep=2pt,fill},line cap=round,line join=round,font=\sffamily,thick]
 \path[use as bounding box] (-5.5,-2)   rectangle (5.5,8);
 \begin{scope}[tdplot_main_coords,scale=1/40,shift={(-128,-128,0)}]
  \draw[-stealth] (0,0,0) coordinate (O) -- (280,0,0) coordinate[label=below:Cr] (Cr);
  \draw[-stealth]  (O) -- (0,280,0) coordinate[label=below:Cb] (Cb);
  \draw[-stealth]  (O) -- (0,0,280) coordinate[label=left:Y] (Y);
  \path [RGB coordinate={(255,255,255)}] node[bullet,draw,fill=white] (white){}
    [RGB coordinate={(0,0,0)}] node[bullet] (black){}
    [RGB coordinate={(255,0,0)}] node[bullet,red] (red){}
    [RGB coordinate={(0,255,0)}] node[bullet,green] (green){}
    [RGB coordinate={(0,0,255)}] node[bullet,blue] (blue){}
    [RGB coordinate={(255,0,255)}] node[bullet,magenta] (magenta){}
    [RGB coordinate={(255,255,0)}] node[bullet,yellow] (yellow){}
    [RGB coordinate={(0,255,255)}] node[bullet,cyan] (cyan){};
   \draw (red) -- (black) -- (blue) -- (magenta) -- (red) -- (yellow)
   -- (green) edge (black) -- (cyan) edge (blue) -- (white)  edge (magenta) -- (yellow);
   \draw[thin] (255,255,0) -- (255,0,0) node[pos=1.1]{255}
   (255,255,0) --(0,255,0) node[pos=1.1]{255}
   (0,0,255) node[left]{255} -- (255,0,255) edge (255,0,0)
    -- (255,255,255)  edge (255,255,0) -- (0,255,255)  edge (0,255,0)
   -- cycle ;
 \end{scope}
\end{tikzpicture}}
\end{document}

Claro, pode-se fazer com que as conexões exibam transições de cores.
\documentclass[tikz,border=3mm]{standalone}
\usepackage{tikz-3dplot}
\def\matCC{{0.257, 0.504, 0.098},%
        {-0.148, -0.291, 0.439},%
        {0.439, -0.368,0.071}}%
\pgfmathdeclarefunction{RGBvec}{3}{%
\begingroup%
\pgfmathsetmacro{\myY}{16+{\matCC}[0][0]*#1+{\matCC}[0][1]*#2+{\matCC}[0][2]*#3}%
\pgfmathsetmacro{\myCb}{128+{\matCC}[1][0]*#1+{\matCC}[1][1]*#2+{\matCC}[1][2]*#3}%
\pgfmathsetmacro{\myCr}{128+{\matCC}[2][0]*#1+{\matCC}[2][1]*#2+{\matCC}[2][2]*#3}%
\edef\pgfmathresult{\myCr,\myCb,\myY}%
\pgfmathsmuggle\pgfmathresult\endgroup%
}%
\tikzset{RGB coordinate/.code args={(#1,#2,#3)}{\pgfmathparse{RGBvec(#1,#2,#3)}%
    \tikzset{insert path={(\pgfmathresult)}}}}
\begin{document}
\tdplotsetmaincoords{70}{110}
\begin{tikzpicture}[bullet/.style={circle,inner
    sep=2pt,outer sep=0pt,fill},connection bar/.style args={(#1)--(#2)}{%
    insert path={let \p1=(#1),\p2=(#2),\n1={atan2(\y2-\y1,\x2-\x1)} in
    [left color=#1,right color=#2,shading angle=\n1+90]
    (#1.\n1-25) arc(\n1-25:\n1+25:40*2pt)
    -- (#2.\n1-180-25)  arc(\n1-180-25:\n1-180+25:40*2pt) -- cycle}},
    line cap=round,line join=round,font=\sffamily,thick]
 \path[use as bounding box] (-5.5,-2)   rectangle (5.5,8);
 \begin{scope}[tdplot_main_coords,scale=1/40,shift={(-128,-128,0)}]
  \draw[-stealth] (0,0,0) coordinate (O) -- (280,0,0) coordinate[label=below:Cr] (Cr);
  \draw[-stealth]  (O) -- (0,280,0) coordinate[label=below:Cb] (Cb);
  \draw[-stealth]  (O) -- (0,0,280) coordinate[label=left:Y] (Y);
  \path [RGB coordinate={(255,255,255)}] node[bullet,draw,fill=white] (white){}
    [RGB coordinate={(0,0,0)}] node[bullet] (black){}
    [RGB coordinate={(255,0,0)}] node[bullet,red] (red){}
    [RGB coordinate={(0,255,0)}] node[bullet,green] (green){}
    [RGB coordinate={(0,0,255)}] node[bullet,blue] (blue){}
    [RGB coordinate={(255,0,255)}] node[bullet,magenta] (magenta){}
    [RGB coordinate={(255,255,0)}] node[bullet,yellow] (yellow){}
    [RGB coordinate={(0,255,255)}] node[bullet,cyan] (cyan){};
  \path[connection bar={(black)--(blue)}];
  \path[connection bar={(blue)--(magenta)}];
  \path[connection bar={(magenta)--(red)}];
  \path[connection bar={(red)--(black)}];
  \path[connection bar={(white)--(magenta)}];
  \path[connection bar={(cyan)--(blue)}];
  \path[connection bar={(green)--(black)}];
  \path[connection bar={(yellow)--(red)}];
  \path[connection bar={(yellow)--(green)}];
  \path[connection bar={(green)--(cyan) }];
  \path[connection bar={(cyan)--(white)}];
  \path[connection bar={(white)--(yellow)}];
   \draw[thin] (255,255,0) -- (255,0,0) node[pos=1.1]{255}
   (255,255,0) --(0,255,0) node[pos=1.1]{255}
   (0,0,255) node[left]{255} -- (255,0,255) edge (255,0,0)
    -- (255,255,255)  edge (255,255,0) -- (0,255,255)  edge (0,255,0)
   -- cycle ;
 \end{scope}
\end{tikzpicture}
\end{document}

Algumas observações:
- Em princípio, existe uma maneira muito mais simples de fazer transformação linear:
\begin{scope}[x={(x)},y={(y)},x={(y)}] ... \end{scope}, onde(x),(y)e(z)são os vetores de base. Mas com a mudança adicional as coisas ficam um pouco confusas, e pensei que ter as coordenadas explicitamente poderia fazer sentido. \pgfshadecolortorgbpermite converter uma cor em coordenadas RGB. Ao escrever este post, não pensei em usá-lo.
Responder2
Um ponto de partida. Agora você pode desenhar em coordenadas 3D. Olhando para o seu perfil, acredito que você pode fazer isso.
\documentclass[tikz,margin=3]{standalone}
\usetikzlibrary{arrows.meta}
\begin{document}
\begin{tikzpicture}[z={(-135:.5)},>=Stealth]
  \draw[thick,->] (0,0,0) -- (5,0,0) node[below] {Cb};
  \draw[thick,->] (0,0,0) -- (0,5,0) node[left] {Y};
  \draw[thick,->] (0,0,0) -- (0,0,5) node[below] {Cr};
  \draw (4,0,0) node[anchor=135] {255} |- (0,4,0) node[anchor=-30] {255}
    -- (0,4,4) |- (4,0,4) -- cycle
    (0,4,4) -| (4,0,4) (4,4,4) -- (4,4,0)
    (0,0,4) node[anchor=-30] {255};
  \path (0,0) node[below] {0};
\end{tikzpicture}
\end{document}
