


我想使用歐拉角進行最終旋轉。在這個連結中歐拉角,最終的旋轉會經歷三個連續的旋轉,從幀(x,y,z)開始,經過(x',y',z'),然後(x'',y'',z''),最後結束與框架 (x''',y''',z''')。我看過這個郵政這在某種程度上幫助了我。就我而言,第一次輪換產生

第二次旋轉產生

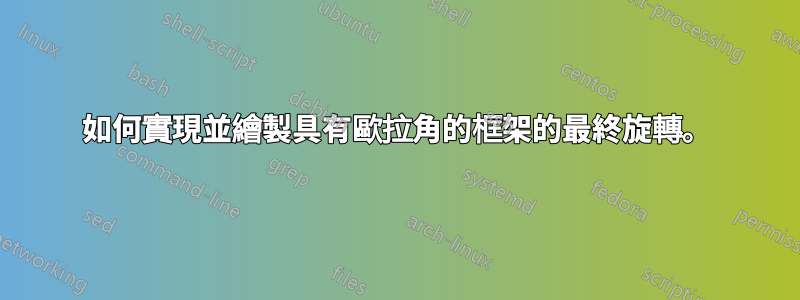
現在第三次旋轉不會產生上述連結中的內容。

x2、x3 應指向同一方向。
這是程式碼
\documentclass[preview,varwidth ,multi,border=3pt]{standalone}

\usepackage{tikz}
\usepackage{tikz-3dplot}
\usepackage[active,tightpage]{preview}
\PreviewEnvironment{tikzpicture}
\setlength\PreviewBorder{1cm}


\begin{document}

\tdplotsetmaincoords{70}{100}

\begin{tikzpicture}[scale=5,tdplot_main_coords]

\coordinate (O) at (0,0,0);

% main Frame (x,y,z)
\draw[thick,->,line width=0.55mm] (O) -- (2.0,0,0) node[anchor=north west]{$X$};
\draw[thick,->,line width=0.55mm] (O) -- (0,2.0,0) node[anchor=west]      {$Y$};
\draw[thick,->,line width=0.55mm] (O) -- (0,0,2.0) node[anchor=south]     {$Z$};


% define yaw, pitch, and roll
\def \yaw   {30}
\def \roll  {30}
\def \pitch {30}

%_____________________________________________________________________
%%%%%%%%%%%%%%%%%%%%%%%%%%%%%%%%%%%%%%%%%%%%%%%%%%%%%%%%%%%%%%%%%%%%%%
%%%%%%%%%%%%%%%%%%%%%%%%%%%%( Yaw )%%%%%%%%%%%%%%%%%%%%%%%%%%%%%%%%%%%
%%%%%%%%%%%%%%%%%%%%%%%%%%%%%%%%%%%%%%%%%%%%%%%%%%%%%%%%%%%%%%%%%%%%%%

% First rotation yields Frame 1 (about z axis main)
% Frame 1 (x1,y1, z1)
\tdplotsetrotatedcoords{\yaw}{0}{0}


\draw[thick,->,line width=0.65mm, color=red, tdplot_rotated_coords]
(O) -- (1.5,0,0) node[xshift=0mm,anchor=north west] {$x^{1}$};
\draw[thick,->,line width=0.65mm, color=red, tdplot_rotated_coords]
(O) -- (0,1.5,0) node[anchor=west]{$y^{1}$};
\draw[thick,->,line width=0.65mm, color=red, tdplot_rotated_coords]
(O) -- (0,0,1.5)  node[anchor=south,xshift=3mm, yshift=-1mm]{$z^{1}$};

%_____________________________________________________________________
%%%%%%%%%%%%%%%%%%%%%%%%%%%%%%%%%%%%%%%%%%%%%%%%%%%%%%%%%%%%%%%%%%%%%%
%%%%%%%%%%%%%%%%%%%%%%%%%%%%( Pitch )%%%%%%%%%%%%%%%%%%%%%%%%%%%%%%%%%
%%%%%%%%%%%%%%%%%%%%%%%%%%%%%%%%%%%%%%%%%%%%%%%%%%%%%%%%%%%%%%%%%%%%%%

% Second rotation yields Frame 2 (about y1 axis)
% Frame 2 (x2,y2, z2)
\tdplotsetrotatedcoords{\yaw}{\pitch}{0}


\draw[thick,->,line width=0.65mm, color=blue, tdplot_rotated_coords]
(O) -- (1.0,0,0) node[xshift=0mm,anchor=north west]{$x^{2}$};
\draw[thick,->,line width=0.65mm, color=blue,tdplot_rotated_coords]
(O) -- (0,1.0,0) node[anchor=west]{$y^{2}$};
\draw[thick,->,line width=0.65mm, color=blue,tdplot_rotated_coords]
(O) -- (0,0,1.0)  node[anchor=south,xshift=3mm, yshift=-1mm]{$z^{2}$};


%_____________________________________________________________________
%%%%%%%%%%%%%%%%%%%%%%%%%%%%%%%%%%%%%%%%%%%%%%%%%%%%%%%%%%%%%%%%%%%%%%
%%%%%%%%%%%%%%%%%%%%%%%%%%%%( Roll )%%%%%%%%%%%%%%%%%%%%%%%%%%%%%%%%%%
%%%%%%%%%%%%%%%%%%%%%%%%%%%%%%%%%%%%%%%%%%%%%%%%%%%%%%%%%%%%%%%%%%%%%%

% Third rotation yields Frame 3 (about x2 axis) <-- (it should be )
% Frame 3 (x3,y3,z3)
\tdplotsetrotatedcoords{\yaw}{\pitch}{\roll}


\draw[thick,->,line width=0.65mm, color=green, tdplot_rotated_coords]
(O) -- (0.5,0,0) node[xshift=0mm,anchor=north west]{$x^{3}$};
\draw[thick,->,line width=0.65mm, color=green,tdplot_rotated_coords]
(O) -- (0,0.5,0) node[anchor=west]{$y^{3}$};
\draw[thick,->,line width=0.65mm, color=green,tdplot_rotated_coords]
(O) -- (0,0,.5)  node[anchor=south]{$z^{3}$};


\end{tikzpicture}


\end{document}
答案1
我認為這可能是重複的tikz-3dplot 中的導航系統座標:預設情況下,tikz-3dplot使用旋轉順序 ZYZ(即先繞 Z 軸旋轉,然後繞新 Y 軸 Y' 旋轉,然後繞新 Z 軸 Z'' 旋轉),而您需要旋轉順序 ZYX。為此,您必須重新定義轉換參數:
\newcommand{\tdseteulerxyz}{
\renewcommand{\tdplotcalctransformrotmain}{%
%perform some trig for the Euler transformation
\tdplotsinandcos{\sinalpha}{\cosalpha}{\tdplotalpha}
\tdplotsinandcos{\sinbeta}{\cosbeta}{\tdplotbeta}
\tdplotsinandcos{\singamma}{\cosgamma}{\tdplotgamma}
%
\tdplotmult{\sasb}{\sinalpha}{\sinbeta}
\tdplotmult{\sasg}{\sinalpha}{\singamma}
\tdplotmult{\sasbsg}{\sasb}{\singamma}
%
\tdplotmult{\sacb}{\sinalpha}{\cosbeta}
\tdplotmult{\sacg}{\sinalpha}{\cosgamma}
\tdplotmult{\sasbcg}{\sasb}{\cosgamma}
%
\tdplotmult{\casb}{\cosalpha}{\sinbeta}
\tdplotmult{\cacb}{\cosalpha}{\cosbeta}
\tdplotmult{\cacg}{\cosalpha}{\cosgamma}
\tdplotmult{\casg}{\cosalpha}{\singamma}
%
\tdplotmult{\cbsg}{\cosbeta}{\singamma}
\tdplotmult{\cbcg}{\cosbeta}{\cosgamma}
%
\tdplotmult{\casbsg}{\casb}{\singamma}
\tdplotmult{\casbcg}{\casb}{\cosgamma}
%
%determine rotation matrix elements for Euler transformation
\pgfmathsetmacro{\raaeul}{\cacb}
\pgfmathsetmacro{\rabeul}{\casbsg - \sacg}
\pgfmathsetmacro{\raceul}{\sasg + \casbcg}
\pgfmathsetmacro{\rbaeul}{\sacb}
\pgfmathsetmacro{\rbbeul}{\sasbsg + \cacg}
\pgfmathsetmacro{\rbceul}{\sasbcg - \casg}
\pgfmathsetmacro{\rcaeul}{-\sinbeta}
\pgfmathsetmacro{\rcbeul}{\cbsg}
\pgfmathsetmacro{\rcceul}{\cbcg}
}
}
然後您可以使用 啟動新的旋轉順序\tdseteulerxyz。

這是完整的程式碼:
\documentclass[border=3pt]{standalone}

\usepackage{tikz}
\usepackage{tikz-3dplot}


\newcommand{\tdseteulerxyz}{
\renewcommand{\tdplotcalctransformrotmain}{%
%perform some trig for the Euler transformation
\tdplotsinandcos{\sinalpha}{\cosalpha}{\tdplotalpha}
\tdplotsinandcos{\sinbeta}{\cosbeta}{\tdplotbeta}
\tdplotsinandcos{\singamma}{\cosgamma}{\tdplotgamma}
%
\tdplotmult{\sasb}{\sinalpha}{\sinbeta}
\tdplotmult{\sasg}{\sinalpha}{\singamma}
\tdplotmult{\sasbsg}{\sasb}{\singamma}
%
\tdplotmult{\sacb}{\sinalpha}{\cosbeta}
\tdplotmult{\sacg}{\sinalpha}{\cosgamma}
\tdplotmult{\sasbcg}{\sasb}{\cosgamma}
%
\tdplotmult{\casb}{\cosalpha}{\sinbeta}
\tdplotmult{\cacb}{\cosalpha}{\cosbeta}
\tdplotmult{\cacg}{\cosalpha}{\cosgamma}
\tdplotmult{\casg}{\cosalpha}{\singamma}
%
\tdplotmult{\cbsg}{\cosbeta}{\singamma}
\tdplotmult{\cbcg}{\cosbeta}{\cosgamma}
%
\tdplotmult{\casbsg}{\casb}{\singamma}
\tdplotmult{\casbcg}{\casb}{\cosgamma}
%
%determine rotation matrix elements for Euler transformation
\pgfmathsetmacro{\raaeul}{\cacb}
\pgfmathsetmacro{\rabeul}{\casbsg - \sacg}
\pgfmathsetmacro{\raceul}{\sasg + \casbcg}
\pgfmathsetmacro{\rbaeul}{\sacb}
\pgfmathsetmacro{\rbbeul}{\sasbsg + \cacg}
\pgfmathsetmacro{\rbceul}{\sasbcg - \casg}
\pgfmathsetmacro{\rcaeul}{-\sinbeta}
\pgfmathsetmacro{\rcbeul}{\cbsg}
\pgfmathsetmacro{\rcceul}{\cbcg}
}
}

\begin{document}
\tdseteulerxyz
\tdplotsetmaincoords{70}{100}

\begin{tikzpicture}[scale=5,tdplot_main_coords]

\coordinate (O) at (0,0,0);

% main Frame (x,y,z)
\draw[thick,->,line width=0.55mm] (O) -- (2.0,0,0) node[anchor=north west]{$X$};
\draw[thick,->,line width=0.55mm] (O) -- (0,2.0,0) node[anchor=west]      {$Y$};
\draw[thick,->,line width=0.55mm] (O) -- (0,0,2.0) node[anchor=south]     {$Z$};


% define yaw, pitch, and roll
\def \yaw   {30}
\def \roll  {30}
\def \pitch {30}

%_____________________________________________________________________
%%%%%%%%%%%%%%%%%%%%%%%%%%%%%%%%%%%%%%%%%%%%%%%%%%%%%%%%%%%%%%%%%%%%%%
%%%%%%%%%%%%%%%%%%%%%%%%%%%%( Yaw )%%%%%%%%%%%%%%%%%%%%%%%%%%%%%%%%%%%
%%%%%%%%%%%%%%%%%%%%%%%%%%%%%%%%%%%%%%%%%%%%%%%%%%%%%%%%%%%%%%%%%%%%%%

% First rotation yields Frame 1 (about z axis main)
% Frame 1 (x1,y1, z1)
\tdplotsetrotatedcoords{\yaw}{0}{0}


\draw[thick,->,line width=0.65mm, color=red, tdplot_rotated_coords]
(O) -- (1.5,0,0) node[xshift=0mm,anchor=north west] {$x^{1}$};
\draw[thick,->,line width=0.65mm, color=red, tdplot_rotated_coords]
(O) -- (0,1.5,0) node[anchor=west]{$y^{1}$};
\draw[thick,->,line width=0.65mm, color=red, tdplot_rotated_coords]
(O) -- (0,0,1.5)  node[anchor=south,xshift=3mm, yshift=-1mm]{$z^{1}$};

%_____________________________________________________________________
%%%%%%%%%%%%%%%%%%%%%%%%%%%%%%%%%%%%%%%%%%%%%%%%%%%%%%%%%%%%%%%%%%%%%%
%%%%%%%%%%%%%%%%%%%%%%%%%%%%( Pitch )%%%%%%%%%%%%%%%%%%%%%%%%%%%%%%%%%
%%%%%%%%%%%%%%%%%%%%%%%%%%%%%%%%%%%%%%%%%%%%%%%%%%%%%%%%%%%%%%%%%%%%%%

% Second rotation yields Frame 2 (about y1 axis)
% Frame 2 (x2,y2, z2)
\tdplotsetrotatedcoords{\yaw}{\pitch}{0}


\draw[thick,->,line width=0.65mm, color=blue, tdplot_rotated_coords]
(O) -- (1.0,0,0) node[xshift=0mm,anchor=north west]{$x^{2}$};
\draw[thick,->,line width=0.65mm, color=blue,tdplot_rotated_coords]
(O) -- (0,1.0,0) node[anchor=west]{$y^{2}$};
\draw[thick,->,line width=0.65mm, color=blue,tdplot_rotated_coords]
(O) -- (0,0,1.0)  node[anchor=south,xshift=3mm, yshift=-1mm]{$z^{2}$};


%_____________________________________________________________________
%%%%%%%%%%%%%%%%%%%%%%%%%%%%%%%%%%%%%%%%%%%%%%%%%%%%%%%%%%%%%%%%%%%%%%
%%%%%%%%%%%%%%%%%%%%%%%%%%%%( Roll )%%%%%%%%%%%%%%%%%%%%%%%%%%%%%%%%%%
%%%%%%%%%%%%%%%%%%%%%%%%%%%%%%%%%%%%%%%%%%%%%%%%%%%%%%%%%%%%%%%%%%%%%%

% Third rotation yields Frame 3 (about x2 axis) <-- (it should be )
% Frame 3 (x3,y3,z3)
\tdplotsetrotatedcoords{\yaw}{\pitch}{\roll}


\draw[thick,->,line width=0.65mm, color=green, tdplot_rotated_coords]
(O) -- (0.5,0,0) node[xshift=0mm,anchor=north west]{$x^{3}$};
\draw[thick,->,line width=0.65mm, color=green,tdplot_rotated_coords]
(O) -- (0,0.5,0) node[anchor=west]{$y^{3}$};
\draw[thick,->,line width=0.65mm, color=green,tdplot_rotated_coords]
(O) -- (0,0,.5)  node[anchor=south]{$z^{3}$};


\end{tikzpicture}


\end{document}